

Utility of an Archival Dried Blood Spot (DBS) Collection from HIV-Infected Individuals with and without Cancer in a Resource-Limited Setting
- PMID: 39408570
- PMCID: PMC11477152
- DOI: 10.3390/ijms251910235
Utility of an Archival Dried Blood Spot (DBS) Collection from HIV-Infected Individuals with and without Cancer in a Resource-Limited Setting
Abstract
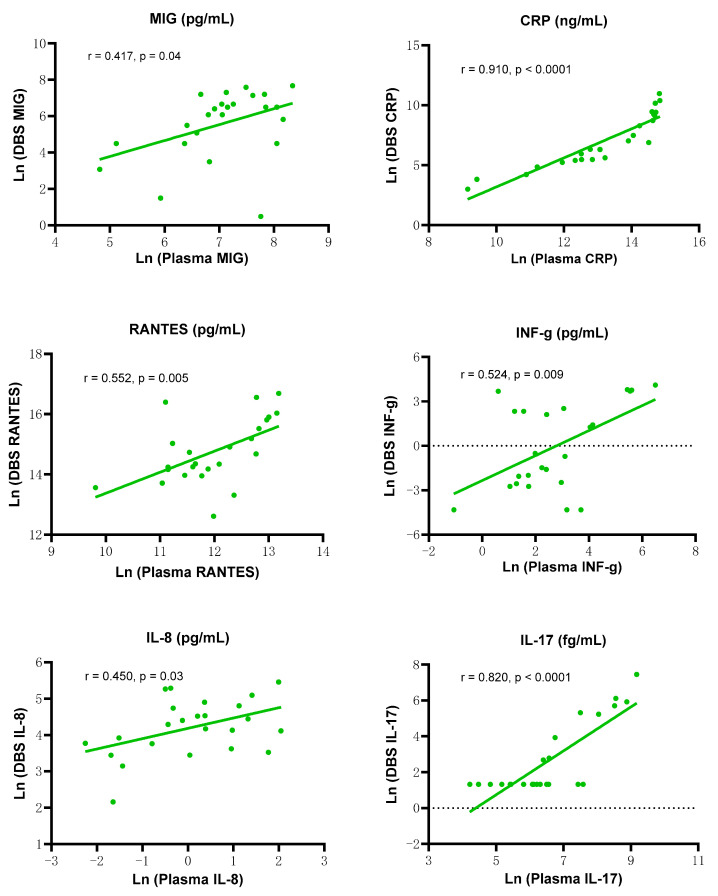
The frequency of virus-associated cancers is growing worldwide, especially in resource-limited settings. One of the biggest challenges in cancer research among people living with HIV (PLWH) has been understanding how infection with both HIV and Kaposi sarcoma-associated herpesvirus (KSHV) promotes the pathogenesis of Kaposi sarcoma (KS), the most common cancer among PLWH worldwide and a significant public health problem in regions with high prevalence of HIV such as Sub-Saharan Africa (SSA). The AIDS and Cancer Specimen Resource (ACSR) provides samples for research, including dried blood spots (DBS) that were collected from large clinical epidemiology studies of KSHV and KS in PLWH conducted more than a decade ago in SSA. Here, we validated the quality of DNA derived from DBS samples from SSA studies and provided evidence of quantitative recovery of inflammatory cytokines using these DBS samples through comparison with paired frozen plasma. Significant differences in DNA, protein yields, and inflammatory biomarker levels were also observed between PLWH with/without KS. Establishing the fitness of DBS samples for studies of KS pathogenesis extends the number of projects that can be supported by these ACSR special collections and provides evidence that DBS collection for future KS research is a practical option in resource-limited settings.
Keywords: AIDS and Cancer Specimen Resource (ACSR); DNA; HIV; Kaposi sarcoma (KS); Kaposi sarcoma-associated herpesvirus (KSHV); archival dried blood spot (DBS); inflammatory cytokines.
Conflict of interest statement
The authors declare no conflicts of interest.
Figures


Similar articles
-
Immune reconstitution inflammatory syndrome associated with Kaposi sarcoma: higher incidence and mortality in Africa than in the UK.AIDS. 2013 Jun 19;27(10):1603-13. doi: 10.1097/QAD.0b013e328360a5a1. AIDS. 2013. PMID: 23462220
-
The clinical application of plasma Kaposi sarcoma herpesvirus viral load as a tumour biomarker: results from 704 patients.HIV Med. 2016 Jan;17(1):56-61. doi: 10.1111/hiv.12273. Epub 2015 Jun 25. HIV Med. 2016. PMID: 26111246
-
Reduced levels of neutralizing antibodies to Kaposi sarcoma-associated herpesvirus in persons with a history of Kaposi sarcoma.J Infect Dis. 2004 Jun 1;189(11):2016-22. doi: 10.1086/386371. Epub 2004 May 11. J Infect Dis. 2004. PMID: 15143468
-
Recent advances in HIV-associated Kaposi sarcoma.F1000Res. 2019 Jun 26;8:F1000 Faculty Rev-970. doi: 10.12688/f1000research.17401.1. eCollection 2019. F1000Res. 2019. PMID: 31297181 Free PMC article. Review.
-
Epidemiology of Kaposi's sarcoma in sub-Saharan Africa.Cancer Epidemiol. 2022 Jun;78:102167. doi: 10.1016/j.canep.2022.102167. Epub 2022 Apr 30. Cancer Epidemiol. 2022. PMID: 35504064 Review.
References
-
- Beyerl J., Rubio-Acero R., Castelletti N., Paunovic I., Kroidl I., Khan Z.N., Bakuli A., Tautz A., Oft J., Hoelscher M., et al. A dried blood spot protocol for high throughput analysis of SARS-CoV-2 serology based on the Roche Elecsys anti-N assay. EBioMedicine. 2021;70:103502. doi: 10.1016/j.ebiom.2021.103502. - DOI - PMC - PubMed
-
- Boemer F., Fasquelle C., D’otreppe S., Josse C., Dideberg V., Segers K., Guissard V., Capraro V., Debray F.G., Bours V. A next-generation newborn screening pilot study: NGS on dried blood spots detects causal mutations in patients with inherited metabolic diseases. Sci. Rep. 2017;7:17641. doi: 10.1038/s41598-017-18038-x. - DOI - PMC - PubMed
-
- Kim M.J., Kim S.Y., Lee J.S., Kang S., Park L.-J., Choi W., Jung J.Y., Kim T., Park S.S., Ko J.M., et al. Rapid Targeted Sequencing Using Dried Blood Spot Samples for Patients with Suspected Actionable Genetic Diseases. Ann. Lab. Med. 2023;43:280–289. doi: 10.3343/alm.2023.43.3.280. - DOI - PMC - PubMed
-
- Tuaillon E., Kania D., Pisoni A., Bollore K., Taieb F., Ontsira Ngoyi E.N., Schaub R., Plantier J.-C., Makinson A., Van de Perre P. Dried Blood Spot Tests for the Diagnosis and Therapeutic Monitoring of HIV and Viral Hepatitis B and C. Front. Microbiol. 2020;11:373. doi: 10.3389/fmicb.2020.00373. - DOI - PMC - PubMed
MeSH terms
Substances
Grants and funding
LinkOut - more resources
Full Text Sources
Medical
Research Materials
