. 2024 Sep 24;25(19):10291.
doi: 10.3390/ijms251910291.

New Application of an Old Drug: Anti-Diabetic Properties of Phloroglucinol

Affiliations

New Application of an Old Drug: Anti-Diabetic Properties of Phloroglucinol

Krzysztof Drygalski et al. Int J Mol Sci. .

Abstract

Phloroglucinol (PHG), an analgesic and spasmolytic drug, shows promise in preventing high-fat-diet (HFD)-induced non-alcoholic fatty liver disease (NAFLD) and insulin resistance. In Wistar rats, 10 weeks of PHG treatment did not prevent HFD-induced weight gain but significantly mitigated fasting hyperglycemia, impaired insulin responses, and liver steatosis. This protective effect was not linked to hepatic lipogenesis or AMP-activated protein kinase (AMPK) activation. Instead, PHG improved mitochondrial function by reducing oxidative stress, enhancing ATP production, and increasing anti-oxidant enzyme activity. PHG also relaxed gastric smooth muscles via potassium channel activation and nitric oxide (NO) signaling, potentially delaying gastric emptying. A pilot intervention in pre-diabetic men confirmed PHG's efficacy in improving postprandial glycemic control and altering lipid metabolism. These findings suggest PHG as a potential therapeutic for NAFLD and insulin resistance, acting through mechanisms involving mitochondrial protection, anti-oxidant activity, and gastric motility modulation. Further clinical evaluation is warranted to explore PHG's full therapeutic potential.

Keywords: NAFLD; anti-spasmodic; diabetes; insulin resistance; lipid metabolism; liver steatosis; oxidative stress; phloroglucinol.


Conflict of interest statement

The authors declare no conflicts of interest.

Figures

Figure 1
Figure 1
The effect of PHG treatment on insulin resistance in the NAFLD model. The effect of ten−week HFD feeding of Wistar rats on body weight (A). Mean food (B) and caloric (C) intake. End body weight (D). The effect of ten-week HFD and PHG treatment on oral glucose tolerance test (OGTT) (E), OGTT AUC (F), end-day fasting glucose (G), change in fasting glucose during the experiment (H), insulin tolerance test (ITT) (I), ITT AUC (J), liver mass (K), epididymal fat mass (L), histological liver steatosis (MO). n = 32; * p < 0.05, ** p < 0.01, *** p < 0.001, **** p < 0.0001. If not indicated otherwise * refers to control vs. particular group. For H * refers to day 0 vs. end day. Scale bar refers to 50 μm.
Figure 2
Figure 2
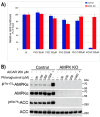
Effect of phloroglucinol on lipid synthesis in control and AMPK-deficient primary mouse hepatocytes. The effect of PHG and AICAR on de novo lipid synthesis (A) and phosphorylation of AMPKα at Thr172, and ACC at Ser79. A representative picture of the Western blotting membrane is shown (B). n = 3.
Figure 3
Figure 3
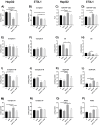
The effect of PHG on mitochondrial function. The effect of PHG on mitochondrial complex I (A,B), complex II (E,F), complexes II+III (I,J) and complex IV (M,N) activity, ATP/ADP ratio (C,D), CS (G,H), DCFH-DA (K,L) and H2O2 production (O,P) in mitochondria isolated from HepG2 and 3T3L1 model of NAFLD respectively. n = 3. * p < 0.05, ** p < 0.01, *** p < 0.001.
Figure 4
Figure 4
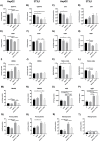
The effect of PHG on mitochondrial enzymatic anti-oxidants, redox ratio and oxidative damage. The effect of PHG on mitochondrial activity of GSH-Px (A,B), CAT (C,D), SOD (E,F), concertation of GSH (G,H) and GSSG (I,J), redox ratio (K,L), TBARS (M,N), AGEs (O,P), peroxynitrite (Q,R) and nitrotyrosine production (S,T) in mitochondria isolated from HepG2 and 3T3L1 model of NAFLD respectively. n = 3. * p < 0.05, ** p < 0.01, *** p < 0.001, **** p < 0.0001.
Figure 5
Figure 5
The effect of PHG on inflammation and apoptosis. The effect of PHG on media TNFα (A,B) and Il-1 (C,D) concentration, as well as mitochondrial expression of Bax (E,F), Bcl-2 (G,H) and Bax/Bcl-2 ratio (I,J) in mitochondria isolated from HepG2 and 3T3L1 model of NAFLD respectively. n = 3. * p < 0.05, ** p < 0.01, *** p < 0.001.
Figure 6
Figure 6
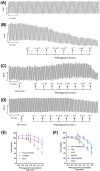
PHG relaxes gastric smooth muscles. A typical recording of carbachol-induced contractile activity of the human gastric strips (A) and the effect of cumulatively administered PHG (range 10−6–10−3 mol/L) (B). Representative recording for the blocking effect of ODQ (C) and 4-AP (D) pre-treatment on PHG-induced muscle relaxation. Effects of PHG after preincubation with L-NAME, ODQ (E); and TEA, 4-AP, ChTX, glibenclamide, or apamin (F) on the gastric strips, as measured by AUC. Each point represents the mean ± SEM of values obtained from individual gastric strips (n = 10) from ten different patients. Contractions of the gastric strips before phloroglucinol were treated as controls. * p < 0.05, ** p < 0.01, *** p < 0.001 versus PHG alone.
Figure 7
Figure 7
The effect of single dose Spasfon 160 mg on postprandial glycemic control and calorimetry in pre-diabetic male volunteers. Meal test and IMP intervention visit design (A). Postprandial glucose level (B), glucose AUC (C), triglyceride (D), insulin (F), insulin AUC (G), free fatty acid level (H). Postprandial change in portal vein diameter (E) and portal flow (I). Postprandial energy expenditure (resting metabolic rate (RMR)) (J), RMR AUC (K), oxygen consumption (L), oxygen consumption AUC (M), carbon dioxide production (N), carbon dioxide production AUC (O), percentage of fat (P), carbohydrates (Q) and protein (R) in substrates utilization. For biochemical assays n = 15, for calorimetry and US examination n = 10. * p < 0.05, ** p < 0.01, *** p < 0.001, **** p < 0.0001 placebo vs. Spasfon 160 mg. For portal diameter and flow * refers to fasting vs. postprandial.
Figure 8
Figure 8
The effect of PHG on lipid metabolism. Pathway analysis of the effects of PHG on postprandial metabolomics (A) and the classification of significantly changed metabolites (B). Main changes in serum metabolites induced by a single-dosage PHG administration in pre-diabetic men (C). The effects of ten-week PHG treatment on mitochondrial activity and oxidative damage in the liver of high-fat-fed Wistar rats (D). For human metabolomics data n = 10, for Wistar NAFLD model n = 32; * p < 0.05, ** p < 0.01.

References

    1. Ward Z.J., Bleich S.N., Cradock A.L., Barrett J.L., Giles C.M., Flax C., Long M.W., Gortmaker S.L. Projected U.S. State-Level Prevalence of Adult Obesity and Severe Obesity. N. Engl. J. Med. 2019;381:2440–2450. doi: 10.1056/NEJMsa1909301. - DOI - PubMed
    1. Mantena S.K., King A.L., Andringa K.K., Eccleston H.B., Bailey S.M. Mitochondrial dysfunction and oxidative stress in the pathogenesis of alcohol- and obesity-induced fatty liver diseases. Free Radic. Biol. Med. 2008;44:1259–1272. doi: 10.1016/j.freeradbiomed.2007.12.029. - DOI - PMC - PubMed
    1. Ansari S., Haboubi H., Haboubi N. Adult obesity complications: Challenges and clinical impact. Ther. Adv. Endocrinol. Metab. 2020;11:2042018820934955. doi: 10.1177/2042018820934955. - DOI - PMC - PubMed
    1. Pérez-Carreras M., Del Hoyo P., Martín M.A., Rubio J.C., Martín A., Castellano G., Colina F., Arenas J., Solis-Herruzo J.A. Defective hepatic mitochondrial respiratory chain in patients with nonalcoholic steatohepatitis. Hepatology. 2003;38:999–1007. doi: 10.1002/hep.1840380426. - DOI - PubMed
    1. Chavin K.D., Yang S.Q., Lin H.Z., Chatham J., Chacko V.P., Hock J.B., Walajtys-Rode E., Rashid A., Chen C.H., Huang C.C., et al. Obesity induces expression of uncoupling protein-2 in hepatocytes and promotes liver ATP depletion. J. Biol. Chem. 1999;274:5692–5700. doi: 10.1074/jbc.274.9.5692. - DOI - PubMed

MeSH terms

LinkOut - more resources