. 2024 Sep 26;25(19):10381.
doi: 10.3390/ijms251910381.

Blockade of mTORC1 via Rapamycin Suppresses 27-Hydroxycholestrol-Induced Inflammatory Responses

Affiliations

Blockade of mTORC1 via Rapamycin Suppresses 27-Hydroxycholestrol-Induced Inflammatory Responses

Nakyung Kang et al. Int J Mol Sci. .

Abstract

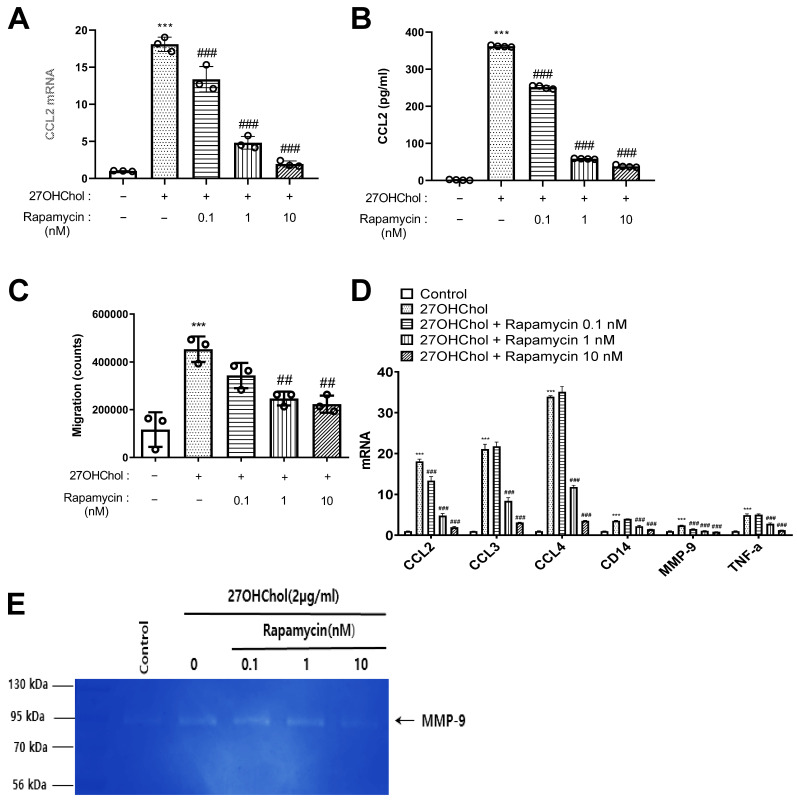
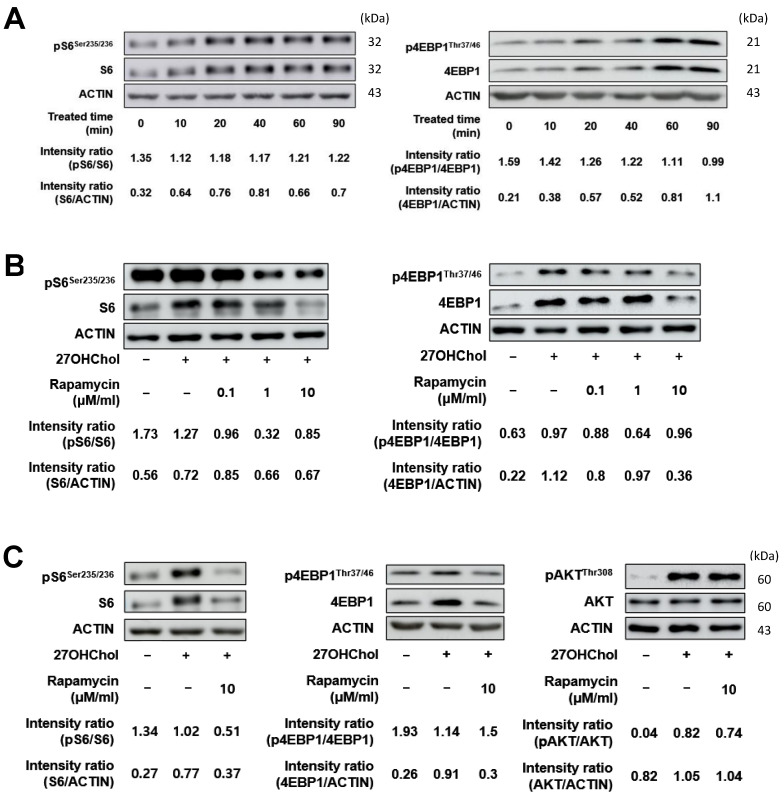
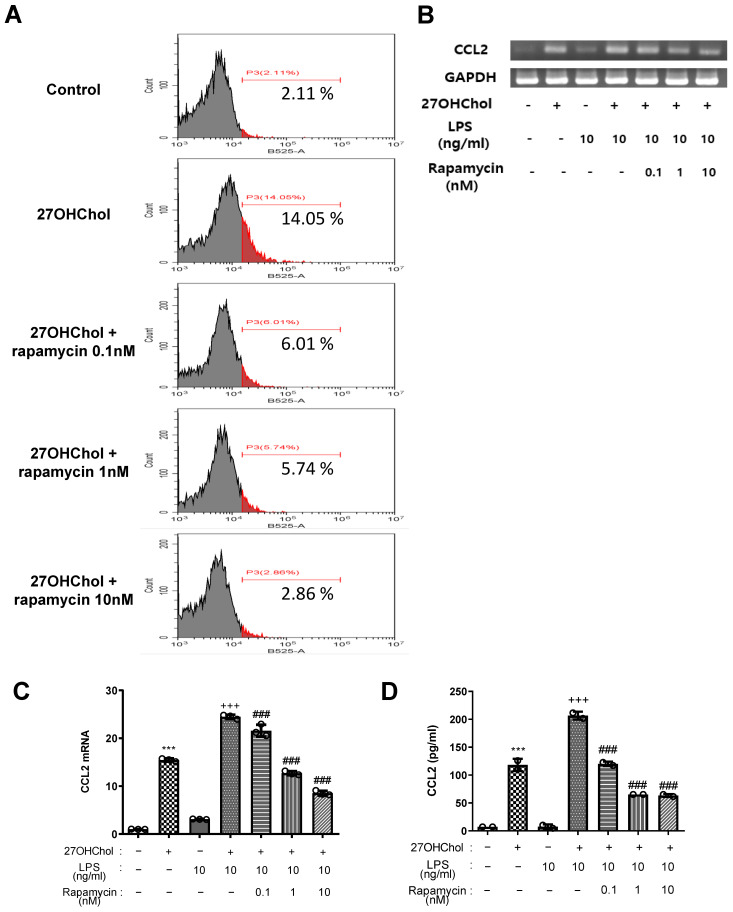
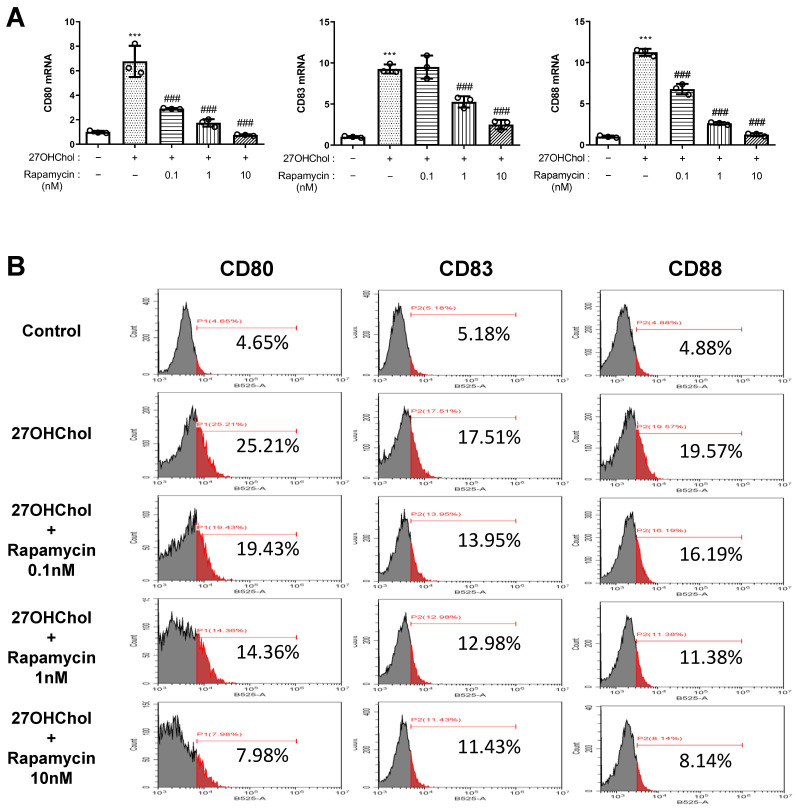
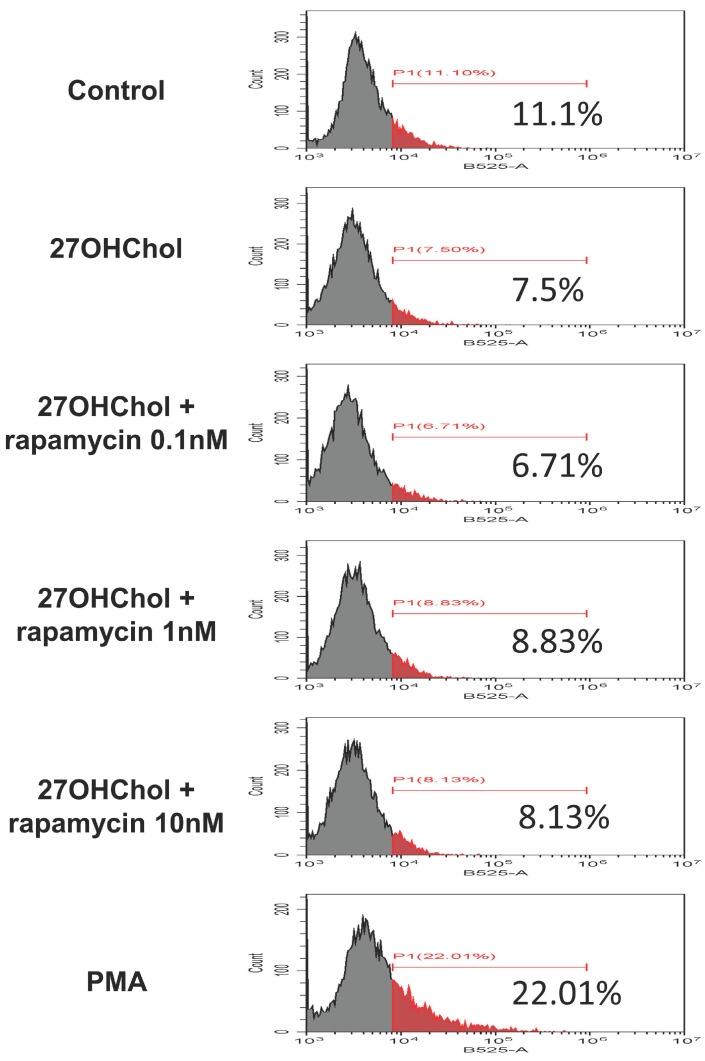
Atherosclerosis is characterized by the deposition and accumulation of extracellular cholesterol and inflammatory cells in the arterial blood vessel walls, and 27-hydroxycholesterol (27OHChol) is the most abundant cholesterol metabolite. 27OHChol is an oxysterol that induces immune responses, including immune cell activation and chemokine secretion, although the underlying mechanisms are not fully understood. In this study, we investigated the roles of the mechanistic target of rapamycin (mTOR) in 27HChol-induced inflammation using rapamycin. Treating monocytic cells with rapamycin effectively reduced the expression of CCL2 and CD14, which was involved with the increased immune response by 27OHChol. Rapamycin also suppressed the phosphorylation of S6 and 4EBP1, which are downstream of mTORC1. Additionally, it also alleviates the increase in differentiation markers into macrophage. These results suggest that 27OHChol induces inflammation by activating the mTORC1 signaling pathway, and rapamycin may be useful for the treatment of atherosclerosis-related inflammation involving 27OHchol.

Keywords: 27-hydroxycholesterol; inflammation; mTOR; monocytic cells; rapamycin.


Conflict of interest statement

The authors declare no conflicts of interest.

Figures

Figure 1
Figure 1
Expression of inflammatory molecules and MMP-9 following treatment with rapamycin. THP-1 cells were serum-starved for 24 h. The cells were treated with 27OHChol (2 μg/mL) in the presence of the indicated amount of rapamycin for 48 h. (A) CCL2 transcript levels were analyzed by real-time PCR. Data are expressed as mean ± SD (n = 3 replicates/group). *** p < 0.001 vs. control; ### p < 0.001 vs. 27OHChol. (B) The amount of CCL2 secreted into the medium was measured by ELISA. Data are expressed as mean ± SD (n = 3 replicates/group). *** p < 0.001 vs. control; ### p < 0.001 vs. 27OHChol. (C) The migration of monocytic cells was determined using chemotaxis assays. Data are expressed as mean ± SD (n = 3 replicates/group). *** p < 0.001 vs. control; ## p < 0.01 vs. 27OHChol. (D) Transcript levels of CCL2, CCL3, CCL4, CD14, MMP-9, and TNF-α were assessed by real-time PCR. Data are expressed as mean ± SD (n = 3 replicates/group). *** p < 0.001 vs. control; ### p < 0.001 vs. 27OHChol. (E) Culture media were isolated, and the activity of MMP-9 secreted by the cells was assessed by gelatin zymography. PCR, polymerase chain reaction; SD, standard deviation; 27OHChol, 27-hydroxycholesterol.
Figure 2
Figure 2
Immunoblots of upstream and downstream proteins of mTORC1 signaling after treatment with 27OHChol. (A) THP-1 cells were serum-starved for 24 h. The serum-starved cells were stimulated with 27OHChol (2 μg/mL) for 0, 10, 20, 40, 60, and 90 min. Western blot analysis was used to detect S6, 4EBP1, and their phosphorylated forms. (B) The cells were treated with 27OHChol (2 μg/mL) in the presence of rapamycin (10 nM) for 40 min. The indicated proteins were detected by immunoblotting. (C) The serum-starved cells were treated with 27OHChol (2 μg/mL) in the presence of varying concentrations of rapamycin for 40 min. Phosphorylated and total levels of S6 and 4EBP1 were detected by immunoblotting. mTORC1, mechanistic target of rapamycin complex 1; 27OHChol, 27-hydroxycholesterol.
Figure 3
Figure 3
Inhibition of 27HChol-induced CD14 expression and inflammatory response by rapamycin in THP-1 cells. Serum-starved THP-1 cells were cultured with 27OHChol in the presence of the indicated amount of rapamycin for 48 h. (A) THP-1 cells were immunostained for surface CD14 and analyzed using flow cytometry. THP-1 cells (2.5 × 10⁵ cells/mL) were serum-starved and incubated for 24 h with 27OHChol in the absence or presence of varying amounts of rapamycin, followed by stimulation for 9 h with or without LPS. (B) CCL2 transcripts were amplified by RT-PCR, and (C) levels of CCL2 transcripts were analyzed by real-time PCR. Data are expressed as mean ± SD (n = 3 replicates for each group). *** p < 0.0001 vs. control; ### p < 0.0001 vs. 27OHChol; +++ p < 0.0001 vs. 27OHChol plus LPS. (D) Culture media were isolated, and the levels of CCL2 in the media were measured by ELISA. Data are expressed as mean ± SD (n = 2 replicates for each group). *** p < 0.0001 vs. control; ### p < 0.0001 vs. 27OHChol; +++ p < 0.0001 vs. 27OHChol plus LPS. RT-PCR, reverse transcriptase polymerase chain reaction; SD, standard deviation; 27OHChol, 27-hydroxycholesterol.
Figure 4
Figure 4
Effects of rapamycin on the maturation of monocytic cells induced by 27HChol. Serum-starved THP-1 cells were cultured with 27OHChol in the presence of the indicated amounts of rapamycin for 48 h. (A) Transcription of CD80, CD83, and CD88 was assessed by real-time PCR. Data are expressed as mean ± SD (n = 3 replicates for each group). *** p < 0.0001 vs. control; ### p < 0.0001 vs. 27OHChol. (B) Cells were immunostained with antibodies against CD80, CD83, and CD88 and analyzed by flow cytometry. PCR, polymerase chain reaction; SD, standard deviation; 27OHChol, 27-hydroxycholesterol.
Figure 5
Figure 5
Effects of rapamycin on functional changes in monocytic cells induced by 27Hchol. Serum-starved THP-1 cells (2.5 × 10⁵ cells/mL) were cultured with 27OHChol in the presence of the indicated amounts of rapamycin for 48 h or 0.25 μM of phorbol myristate acetate (PMA) for 24 h. The fluorescence of the cells was analyzed by flow cytometry after incubation with 0.5 mg/mL FITC-conjugated dextran for 30 min. 27OHChol, 27-hydroxycholesterol; FITC, fluorescein isothiocyanate.

Similar articles

Cited by

References

    1. Mauersberger C., Hinterdobler J., Schunkert H., Kessler T., Sager H.B. Where the Action Is-Leukocyte Recruitment in Atherosclerosis. Front. Cardiovasc. Med. 2021;8:813984. doi: 10.3389/fcvm.2021.813984. - DOI - PMC - PubMed
    1. Libby P., Ridker P.M., Maseri A. Inflammation and atherosclerosis. Circulation. 2002;105:1135–1143. doi: 10.1161/hc0902.104353. - DOI - PubMed
    1. Olkkonen V.M., Béaslas O., Nissilä E. Oxysterols and their cellular effectors. Biomolecules. 2012;2:76–103. doi: 10.3390/biom2010076. - DOI - PMC - PubMed
    1. Lemaire-Ewing S., Prunet C., Montange T., Vejux A., Berthier A., Bessède G., Corcos L., Gambert P., Néel D., Lizard G. Comparison of the cytotoxic, pro-oxidant and pro-inflammatory characteristics of different oxysterols. Cell Biol. Toxicol. 2005;21:97–114. doi: 10.1007/s10565-005-0141-2. - DOI - PubMed
    1. Iuliano L., Micheletta F., Natoli S., Ginanni Corradini S., Iappelli M., Elisei W., Giovannelli L., Violi F., Diczfalusy U. Measurement of oxysterols and alpha-tocopherol in plasma and tissue samples as indices of oxidant stress status. Anal. Biochem. 2003;312:217–223. doi: 10.1016/S0003-2697(02)00467-0. - DOI - PubMed

MeSH terms

LinkOut - more resources