. 2024 Sep 28;25(19):10473.
doi: 10.3390/ijms251910473.

Characterization of Endothelial Cell Subclusters in Localized Scleroderma Skin with Single-Cell RNA Sequencing Identifies NOTCH Signaling Pathway

Affiliations

Characterization of Endothelial Cell Subclusters in Localized Scleroderma Skin with Single-Cell RNA Sequencing Identifies NOTCH Signaling Pathway

Theresa Hutchins et al. Int J Mol Sci. .

Abstract

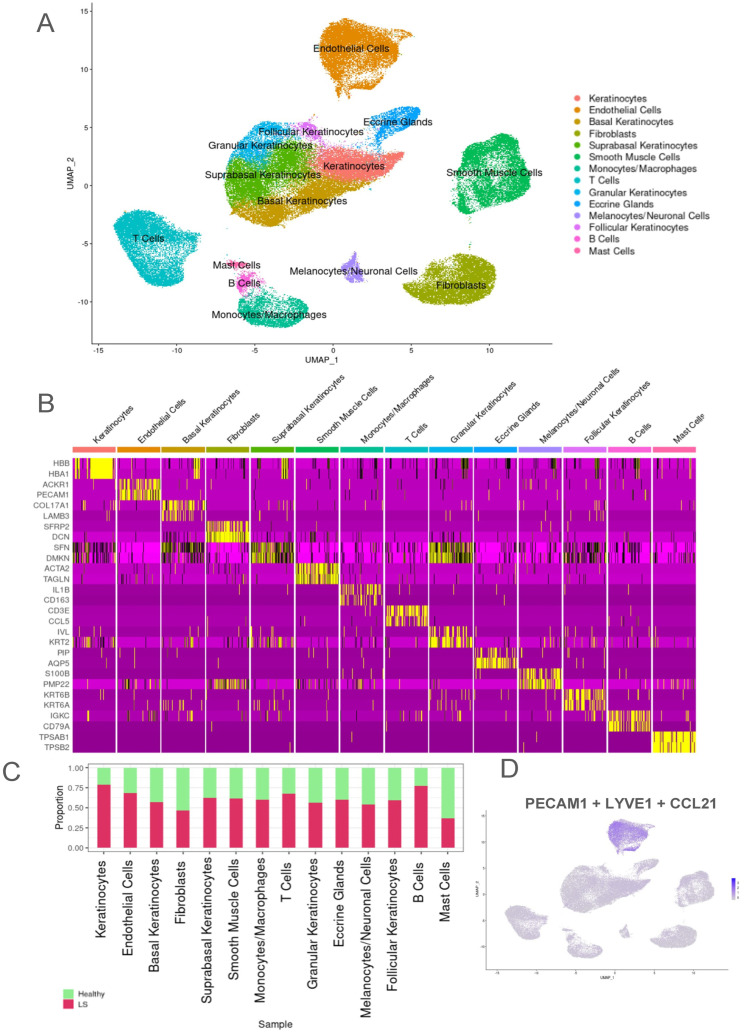
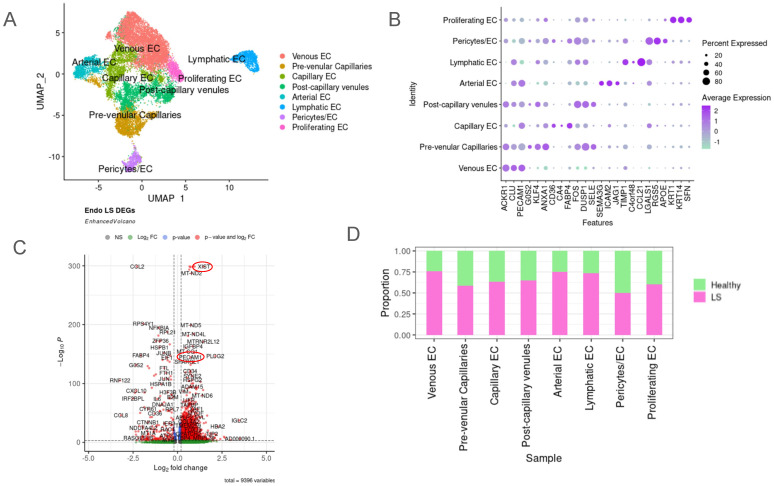
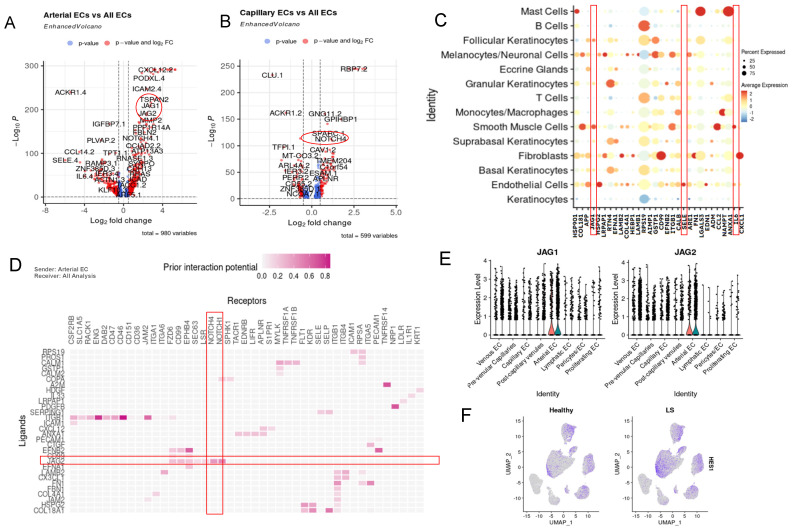
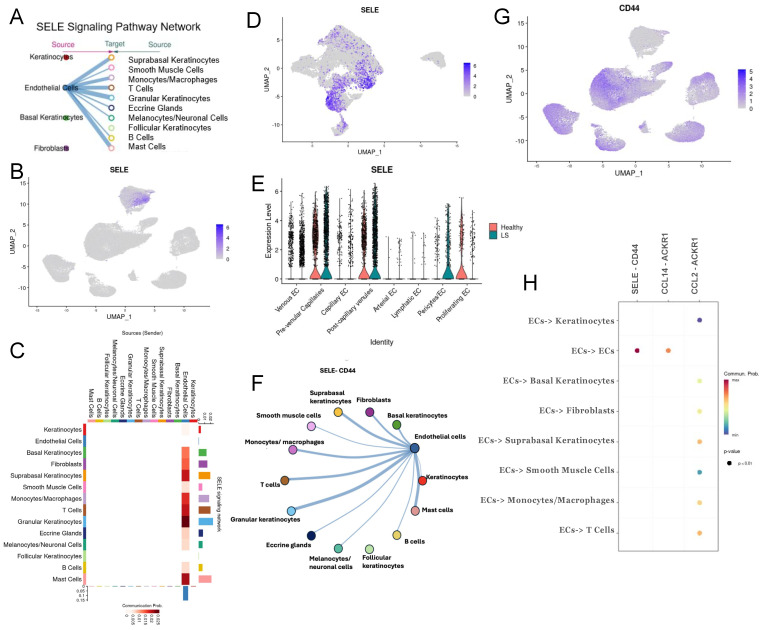
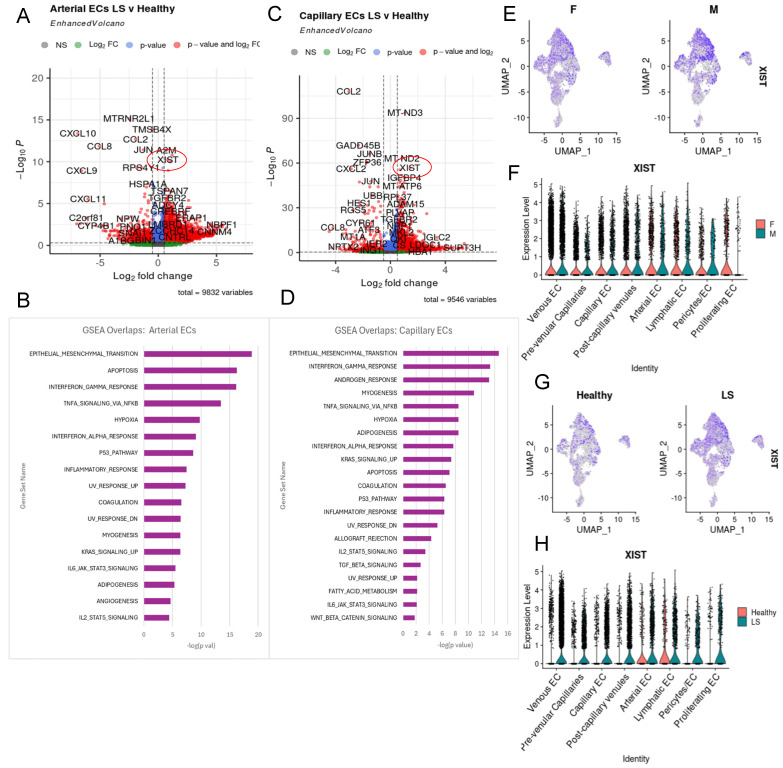
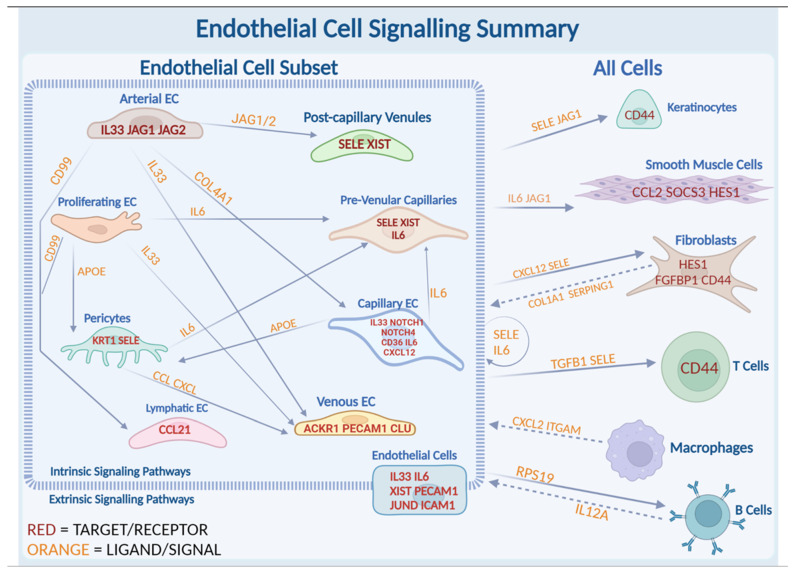
Localized scleroderma (LS) is an autoimmune disease characterized by inflammation and fibrosis, leading to severe cutaneous manifestations such as skin hardening, tightness, discoloration, and other textural changes that may result in disability. While LS shares similar histopathologic features and immune-fibroblast interactions with systemic sclerosis (SSc), its molecular mechanisms remain understudied. Endothelial cells (EC) are known to play a crucial role in SSc but have not been investigated in LS. Single-cell RNA sequencing (scRNA-seq) now allows for detailed examination of this cell type in the primary organ of interest for scleroderma, the skin. In this study, we analyzed skin-isolated cells from 27 LS patients (pediatric and adult) and 17 healthy controls using scRNA-seq. Given the known role of EC damage as an initial event in SSc and the histologic and clinical skin similarities to LS, we focused primarily on endothelial cells. Our analysis identified eight endothelial subclusters within the dataset, encompassing both disease and healthy samples. Interaction analysis revealed that signaling from diseased endothelial cells was predicted to promote fibrosis through SELE interaction with FGFBP1 and other target genes. We also observed high levels of JAG in arterial endothelial cells and NOTCH in capillary endothelial cells, indicating the activation of a signaling pathway potentially responsible for epidermal abnormalities and contributing to LS pathogenesis. In summary, our scRNA-seq analysis identified potential disease-propagating endothelial cell clusters with upregulated pathways in LS skin, highlighting their importance in disease progression.

Keywords: IL33; IL6; JAG-NOTCH signaling; SELE; XIST; endothelial cells; localized scleroderma; morphea; single-cell RNA sequencing; skin.


Conflict of interest statement

The authors declare no conflicts of interest. The funders had no role in the design of the study; in the collection, analyses, or interpretation of data; in the writing of the manuscript; or in the decision to publish the results.

Figures

Figure 1
Figure 1
Transcriptomic evaluation of endothelial cells show higher proportions in LS samples. (A) UMAP of all cells from 44 total samples of LS (27) and healthy (17) samples with a total of 108,239 cells of which 40,715 LS and 67,524 healthy cells clustered into 14 main cell types. (B) Bar graph visualizing the percentage/ proportions of each cell type between LS and healthy cells in the entire population. (C) Heat map used for identifying the different cell clusters using the top 4 genes in each cluster. (D) UMAP feature plot showing composite canonical endothelial cell markers, PECAM1, CCL21, and LYVEI, used to identify the endothelial cell populations.
Figure 2
Figure 2
Unique clusters identified in endothelial cells (EC). (A) A total of 16,766 cells were identified as ECs and were clustered into eight main subsets as seen in the UMAP. These included venous EC, pre-venular capillaries, capillary EC, post-capillary venules, arterial EC, lymphatic EC, pericytes/EC and proliferating EC. (B) Dot plot representing the three main identifying genes for each subcluster of EC. (C) Most EC subclusters had a higher proportion of LS cells, except for pericytes/EC. (D) Volcano plot of dysregulated genes in the overall endothelial cell subset compared with healthy endothelial cells, with attention to XIST and PECAM1 (circled) as significantly upregulated in LS endothelial cells.
Figure 3
Figure 3
Upregulation of JAG/NOTCH Signaling between Arterial and Capillary Endothelial Cells. (A) Volcano plot displaying dysregulated DEGs in the arterial EC cluster vs. all other endothelial cell subclusters showing upregulation in JAG1 and JAG2 (circled in red). (B) Volcano plot displaying dysregulated DEGs in the capillary EC cluster vs. all other endothelial cell subclusters shows upregulation in NOTCH4 (circled in red), LGALS1, COL4A2, C11orf96 and CXCL2. (C) NicheNet interaction dotplot of the top 20 predicted ligands ECs as sender and all cells as receiver. Highlighted are genes of interest, including JAG1, SELE and IL6 (boxed in red). (D) NicheNet ligand-target interaction potential plot displaying the interaction potential between top predicted ligands involved in arterial endothelial cell extrinsic signaling to all other endothelial subsets (weighted by LS vs. Healthy)—projecting JAG2 (boxed in red horizontal) as a top predicted ligand (y-axis) with predicted target genes NOTCH1 and NOTCH4 (x-axis) (boxed in red vertical). (E) The violin plot of JAG1 and JAG2 expression amongst endothelial cells for all EC subclusters. (F) UMAP displaying showing where HES1, an important gene in the JAG/NOTCH pathway, localizes in our all-cells dataset split by healthy vs. LS.
Figure 4
Figure 4
Pathway showing extrinsic SELE signaling in ECs. (A) CellChat paracrine signaling pathway network of SELE in our dataset with cell types listed on the left being SELE expressing cell types—which consists of only endothelial cells. The interactions include signals from endothelial cells to all cells aside from follicular keratinocytes. (B) UMAP displays the clusters where SELE is mostly relevant in all cells from our data and shows its presence in endothelial cells. (C) Signaling matrix using CellChat displays the SELE signaling network with the magnitude of interaction from endothelial cells to other interacting cell type, with the strongest to granular keratinocytes, T cells, mast cells and suprabasal keratinocytes. (D) UMAP displays the location of SELE in the endothelial cells subclusters and shows its expression in pre-venular capillaries, post-capillary venules and proliferating endothelial cells. (E) Violin plot showing the expression level of SELE in each cluster in endothelial cell subset split by health and is more prevalent in healthy population. (F) Circos plot showing interaction pathways of SELE to CD44. (G) UMAP projection of the cell types that express the SELE receptor CD44, which includes all cell types aside from endothelial cells. (H) CellChat’s predicted communication pathways shown that stems from endothelial cells and all other cells. This is included as SELE-CD44 with a positive communication probability for endothelial cells to T cells, monocytes/macrophages and suprabasal keratinocytes.
Figure 5
Figure 5
XIST in LS endothelial cells. (A) Volcano plot showing the top LS vs. healthy DEGs for the arterial cluster. (B) Top 20 GSEA pathway overlaps ranked by p-value based on the top 200 upregulated DEGs in the arterial LS. (C) Volcano plot showing the top LS vs. healthy DEGs for the capillary cluster. (D) Top 20 GSEA pathway overlaps when run on the top 200 upregulated DEGs in LS capillary DEGs. (E,F) Displays the proportion of male vs. female cells that express in endothelial cells in a feature plot and a volcano plot respectively. (G) Shows the expression of XIST via feature plot in our endothelial cell subset split by health. (H) Shows a volcano plot of XIST expression per cluster in our endothelial cell subset split by health with clear prominence in LS cells.
Figure 6
Figure 6
Intrinsic and extrinsic signaling pathways in endothelial cells within themselves or with other cell types upregulated in LS disease process. Interactions amongst different subclusters of endothelial cells and between endothelial cells and all other cell types in our dataset are depicted. Within the endothelial cell subset, the most significant interactions stemming from arterial EC, proliferating EC, pericytes, pre-venular capillaries, lymphatic EC, venous EC and capillary EC are displayed. Additionally, signaling from endothelial cells to keratinocytes, smooth muscle cells, fibroblasts, T cells, macrophages and B cells are illustrated to the right side of the figure. Genes colored orange were identified in CellChat or NicheNet analyses and represent ligands, and genes in red were found in NicheNet or feature plots as receptors or target genes.

Similar articles

References

    1. Li S.C. Scleroderma in Children and Adolescents: Localized Scleroderma and Systemic Sclerosis. Pediatr. Clin. N. Am. 2018;65:757–781. doi: 10.1016/j.pcl.2018.04.002. - DOI - PubMed
    1. Romano E., Rosa I., Fioretto B.S., Matucci-Cerinic M., Manetti M. New Insights into Profibrotic Myofibroblast Formation in Systemic Sclerosis: When the Vascular Wall Becomes the Enemy. Life. 2021;11:610. doi: 10.3390/life11070610. - DOI - PMC - PubMed
    1. Kurzinski K.L., Zigler C.K., Torok K.S. Prediction of disease relapse in a cohort of paediatric patients with localized scleroderma. Br. J. Dermatol. 2019;180:1183–1189. doi: 10.1111/bjd.17312. - DOI - PMC - PubMed
    1. Campbell P.M., LeRoy E.C. Pathogenesis of systemic sclerosis: A vascular hypothesis. Semin. Arthritis Rheumatol. 1975;4:351–368. doi: 10.1016/0049-0172(75)90017-7. - DOI - PubMed
    1. Prescott R.J., Freemont A.J., Jones C.J., Hoyland J., Fielding P. Sequential dermal microvascular and perivascular changes in the development of scleroderma. J. Pathol. 1992;166:255–263. doi: 10.1002/path.1711660307. - DOI - PubMed

MeSH terms