. 2024 Sep 29;25(19):10483.
doi: 10.3390/ijms251910483.

Genomic and Transcriptomic Profile of HNF1A-Mutated Liver Adenomas Highlights Molecular Signature and Potential Therapeutic Implications

Affiliations

Genomic and Transcriptomic Profile of HNF1A-Mutated Liver Adenomas Highlights Molecular Signature and Potential Therapeutic Implications

Angelo Corso Faini et al. Int J Mol Sci. .

Abstract

Hepatocellular adenomas (HAs) are tumors that can develop under different conditions, including in patients harboring a germline mutation in HNF1A. However, little is known about the pathogenesis of such disease. This work aims to better define what mechanisms lie under the development of this condition. Six HAs were sampled from the liver of a 17-year-old male affected by diabetes and multiple hepatic adenomatosis harboring the heterozygous pathogenic germline variant c.815G>A, p.(Arg272His) in HNF1A, which has a dominant negative effect. All HAs were molecularly characterized. Four of them were shown to harbor a second somatic HNF1A variant and one had a mutation in the ARID1A gene, while no additional somatic changes were found in the remaining HA and normal parenchyma. A transcriptomic profile of the same HA samples was also performed. HNF1A biallelic mutations were associated with the up-regulation of several pathways including the tricarboxylic acid cycle, the metabolism of fatty acids, and mTOR signaling while angiogenesis, endothelial and vascular proliferation, cell migration/adhesion, and immune response were down-regulated. Contrariwise, in the tumor harboring the ARID1A variant, angiogenesis was up-modulated while fatty acid metabolism was down-modulated. Histological analyses confirmed the molecular data. Independently of the second mutation, energetic processes and cholesterol metabolism were up-modulated, while the immune response was down-modulated. This work provides a complete molecular signature of HNF1A-associated HAs, analyzing the association between specific HNF1A variants and the development of HA while identifying potential new therapeutic targets for non-surgical treatment.

Keywords: HNF1A; genetics; hepatic adenomas; liver; molecular signature.


Conflict of interest statement

The authors declare no conflicts of interest.

Figures
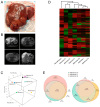
Figure 1
Figure 1
Morphological features of adenomas and molecular similarities between HAs. Picture (A) and representative transversal and coronal NMR scans (B) of the native liver of the patient. Axial T1-weighted gradient recall echo sequences with the phase opposition technique, single-shot T2 sequences with the fat suppression technique, and single-shot T2-weighted and diffusion echo-planar imaging sequences were acquired, and a dynamic study was performed with an intravenous infusion of hepatobiliary paramagnetic contrast medium (Gd-EOB-DTPA). (C) Principal component analysis (PCA) showing the HA samples clustering. (D) Heatmap showing differential gene expression profiles in each sample, reflecting PCA clustering. Hierarchical clustering shows that all HAs cluster together as opposed to normal parenchyma, which stands alone. Among the HA samples, adenomas IV and VI form a cluster as do adenomas I, VII, and VIII, while adenoma V seems to be a cluster on its own. (E) Venn diagrams showing the number and percentage of genes commonly up- or down-modulated (left and right panel, respectively) in adenomas IV, V, and VI. Each circle corresponds to the up- or down-modulated genes in each sample as compared to normal parenchyma.
Figure 2
Figure 2
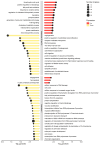
Graphical illustration of the commonly up- and down-modulated pathways in adenomas IV, VI, and V. Each modulated pathway is represented by a line whose length is proportional to the −log10(p-value). Red lines represent up-modulated pathways; yellow lines represent down-modulated pathways. Dot diameter is proportional to the number of genes modulated in each pathway.
Figure 3
Figure 3
Differential gene expression in adenomas IV, V, and VI. Heatmaps representing modulated pathways in adenomas IV, VI (A), and V (B) compared to normal tissue. Modulated genes that are involved in the mTOR signaling pathway are reported on the right side of each graph. (C,D) Scatter plots representing the most significantly down- (C) and up- (D) modulated pathways in all three studied adenomas (IV, V, and VI, independently of the somatic mutation). Colors represent −log10(p-value) and the dot diameter is proportional to the number of genes modulated in each pathway. Immune response and inflammation appear down-regulated, while energetic processes and cholesterol metabolism are up-modulated.
Figure 4
Figure 4
Cell population analysis and morphological and immunohistochemical profile of the HA. (A) Bar plot showing the cellular composition of HA IV, V, VI, and normal tissue. HAs, particularly adenoma VI, seem to be enriched in follicular T-helper cells, which are not present in normal tissue. On the other hand, adenoma VI seems to have a lower number of resting CD4+ T memory cells and a higher percentage of resting dendritic cells. Of note, adenoma V has a small amount of T regulatory cells, which are not present in the other samples. Also, adenoma V is richer in resting mast cells as compared to the other adenomas. (B) Graph showing the percentage of endothelial cells in each studied HA. Three different algorithms were used and all of them—particularly EPIC and EXCELL—showing that adenoma V is richer in endothelial cells. (C) Upon histological analysis, adenoma V presented a wild-type IHC staining pattern for beta-catenin ((Ci) 400× original magnification), negative IHC stain for glutamine ((Cii) 200× original magnification), and negative HNF-1α expression in the nuclei of neoplastic hepatocytes ((Ciii) 400× original magnification). (D) The steatotic lesions presented diffuse large droplet macrovesicular steatosis involving approximately 40% of neoplastic cells ((Di) HE, 100× original magnification). IHC for beta-catenin showed a wild-type staining pattern in neoplastic hepatocytes, characterized by negative nuclear and positive membranous staining ((Dii) 400× original magnification). IHC for glutamine synthetase was negative in all neoplastic hepatocytes ((Diii) 200× original magnification). HNF-1α ((Div) 200× original magnification) was negative in neoplastic hepatocyte nuclei. Remarkably, the lesion of segment V presented less prominent steatosis (involving 20% of neoplastic cells, approximatively) but a slightly increased density of aberrant vessels (black arrowheads, (CiCiii)).

References

    1. Bjørkhaug L., Bratland A., Njølstad P.R., Molven A. Functional Dissection of the HNF-1alpha Transcription Factor: A Study on Nuclear Localization and Transcriptional Activation. DNA Cell Biol. 2005;24:661–669. doi: 10.1089/dna.2005.24.661. - DOI - PubMed
    1. Soutoglou E., Papafotiou G., Katrakili N., Talianidis I. Transcriptional Activation by Hepatocyte Nuclear Factor-1 Requires Synergism between Multiple Coactivator Proteins. J. Biol. Chem. 2000;275:12515–12520. doi: 10.1074/jbc.275.17.12515. - DOI - PubMed
    1. Soutoglou E., Viollet B., Vaxillaire M., Yaniv M., Pontoglio M., Talianidis I. Transcription Factor-Dependent Regulation of CBP and P/CAF Histone Acetyltransferase Activity. EMBO J. 2001;20:1984–1992. doi: 10.1093/emboj/20.8.1984. - DOI - PMC - PubMed
    1. Dohda T., Kaneoka H., Inayoshi Y., Kamihira M., Miyake K., Iijima S. Transcriptional Coactivators CBP and P300 Cooperatively Enhance HNF-1alpha-Mediated Expression of the Albumin Gene in Hepatocytes. J. Biochem. 2004;136:313–319. doi: 10.1093/jb/mvh123. - DOI - PubMed
    1. Ban N., Yamada Y., Someya Y., Miyawaki K., Ihara Y., Hosokawa M., Toyokuni S., Tsuda K., Seino Y. Hepatocyte Nuclear Factor-1alpha Recruits the Transcriptional Co-Activator P300 on the GLUT2 Gene Promoter. Diabetes. 2002;51:1409–1418. doi: 10.2337/diabetes.51.5.1409. - DOI - PubMed

MeSH terms