. 2024 Sep 29;25(19):10505.
doi: 10.3390/ijms251910505.

Interactions between Brassinosteroids and Strigolactones in Alleviating Salt Stress in Maize

Affiliations

Interactions between Brassinosteroids and Strigolactones in Alleviating Salt Stress in Maize

Xinqi Wang et al. Int J Mol Sci. .

Abstract

Exogenous brassinolide (BR) and strigolactones (SLs) play an important role in alleviating salt stress in maize. We studied the morphological and physiological responses of the salt-sensitive genotype PH4CV and salt-tolerant genotype Zheng58 to BR (1.65 nM), SL (1 µM), and BS (1.65 nM BR + 1 µM SL) under salt stress. Phenotypic analysis showed that salt stress significantly inhibited the growth of maize seedlings and significantly increased the content of Na+ in the roots. Exogenous hormones increased oxidase activity and decreased Na+ content in the roots and mitigated salt stress. Transcriptome analysis showed that the interaction of BR and SL is involved in photosynthesis-antenna proteins, the TCA cycle, and plant hormone signal transduction pathways. This interaction influences the expression of chlorophyll a/b-binding protein and glucose-6-phosphate isomerase 1 chloroplastic, and aconitase genes are affected. Furthermore, the application of exogenous hormones regulates the expression of genes associated with the signaling pathways of cytokinin (CK), gibberellins (GA), auxin (IAA), brassinosteroid (BR), abscisic acid (ABA), and jasmonic acid (JA). Additionally, exogenous hormones inhibit the expression of the AKT2/3 genes, which are responsible for regulating ion transduction and potassium ion influx. Four candidate genes that may regulate the seedling length of maize were screened out through WGCNA. Respective KOG notes concerned inorganic ion transport and metabolism, signal transduction mechanisms, energy production and conversion, and amino acid transport and metabolism. The findings of this study provide a foundation for the proposition that BR and SL can be employed to regulate salt stress alleviation in maize.

Keywords: brassinosteroids; hormone interactions; maize (Zea mays L.); salt stress; strigolactones.


Conflict of interest statement

The authors declare no conflicts of interest.

Figures

Figure 1
Figure 1
Phenotypes of seedlings under different treatments. (a) Effects of exogenous hormones on the morphology of maize seedlings under salt stress. (b) Aboveground fresh weight. (c) Underground fresh weight. (d) Seeding length. (e) Root length. Different lowercase letters represent significant differences between treatments by Tukey’s test (p < 0.05).
Figure 2
Figure 2
Comparison of Na and K contents in roots and leaves in Zheng58 and PH4CV. (a) K+ content in leaves. (b) K+ content in roots. (c) Na+ content in leaves. (d) Na+ content in roots. Different letters represent significant within group.
Figure 3
Figure 3
(a) The number distribution of up–down DEGs among different comparison groups; (bd) Venn diagram analysis of DEGs between different comparison groups.
Figure 4
Figure 4
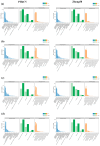
GO analysis of DEGs in two inbred lines under normal treatment and salt stress. (a) CK vs. NaCl. (b) BR vs. BRN. (c) SL vs. SLN. (d) BS vs. BSN.
Figure 5
Figure 5
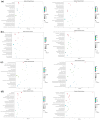
Scatter plot of KEGG enrichment. The horizontal axis represents the ratio of the number of differentially expressed genes annotated to the KEGG pathway to the total number of differentially expressed genes, and the vertical axis represents the KEGG pathway to the total number of differentially expressed genes, representing the KEGG pathway. The size of the points represents the number of genes annotated to the KEGG pathway. The color ranges from red to purple, representing the significance of the enrichment. (a) CK vs. NaCl; (b) BR vs. BRN; (c) SL vs. SLN; (d) BS vs. BSN.
Figure 6
Figure 6
Heat map and cluster analysis of the gene co-expression network. (a) Gene co-expression module construction. (b) Gene co-expression module heat map. (c) Inter-module correlation heat map.
Figure 7
Figure 7
Correlation analysis between modules and phenotypic characteristics. (a) Systematic tree map and correlation heat map of genes. (b) Heat map of module and character correlation.
Figure 8
Figure 8
GO and KEGG annotation analysis of two related gene modules. (a) Blue module gene GO and KEGG annotation analysis. (b) Salmon-colored module gene GO and KEGG annotation analysis.
Figure 9
Figure 9
Interaction analysis of the core gene network in the module. (a) Blue module; (b) salmon-colored module.
Figure 10
Figure 10
Validation of eight randomly selected genes by quantitative real-time PCR (RT-qPCR). The mRNA expression levels were normalized to the expression level of ACTIN, and the means from three biological replicates are shown. Bar charts and line charts represent RT-qPCR and RNA-Seq data, respectively. Different letters represent significant within group.
Figure 11
Figure 11
Interaction model of externally applied brassinosteroid (BR) and strigolactones (SLs) in response to salt stress in maize. The blue boxes denote exogenous SL response nodes, the yellow boxes signify exogenous BR response nodes, and the red fonts indicate exogenous BR-SL response nodes. Blue lines represent SLs regulation, green lines represent possible WRKY65 regulation. Dashed lines represent possible regulation.

Similar articles

Cited by

References

    1. Mukhopadhyay R., Sarkar B., Jat H.S., Sharma P.C., Bolan N.S. Soil salinity under climate change: Challenges for sustainable agriculture and food security. J. Environ. Manag. 2021;280:111736. doi: 10.1016/j.jenvman.2020.111736. - DOI - PubMed
    1. Del Buono D. Can biostimulants be used to mitigate the effect of anthropogenic climate change on agriculture? It is time to respond. Sci. Total Environ. 2021;751:141763. doi: 10.1016/j.scitotenv.2020.141763. - DOI - PubMed
    1. Jiang Z., Zhou X., Tao M., Yuan F., Liu L., Wu F., Wu X., Xiang Y., Niu Y., Liu F., et al. Plant cell-surface GIPC sphingolipids sense salt to trigger Ca2+ influx. Nature. 2019;572:341–346. doi: 10.1038/s41586-019-1449-z. - DOI - PubMed
    1. Li M., Zhu Y., Li S., Zhang W., Yin C., Lin Y. Regulation of Phytohormones on the Growth and Development of Plant Root Hair. Front. Plant Sci. 2022;13:865302. doi: 10.3389/fpls.2022.865302. - DOI - PMC - PubMed
    1. Ciccarelli D., Bottega S., Spano C. Study of functional and physiological response of co-occurring shrub species to the Mediterranean climate. Saudi J. Biol. Sci. 2019;26:1668–1675. doi: 10.1016/j.sjbs.2018.08.021. - DOI - PMC - PubMed

MeSH terms

LinkOut - more resources