. 2024 Sep 29;25(19):10514.
doi: 10.3390/ijms251910514.

The SIRT5-Mediated Upregulation of C/EBPβ Promotes White Adipose Tissue Browning by Enhancing UCP1 Signaling

Affiliations

The SIRT5-Mediated Upregulation of C/EBPβ Promotes White Adipose Tissue Browning by Enhancing UCP1 Signaling

Xiangyun Zhai et al. Int J Mol Sci. .

Abstract

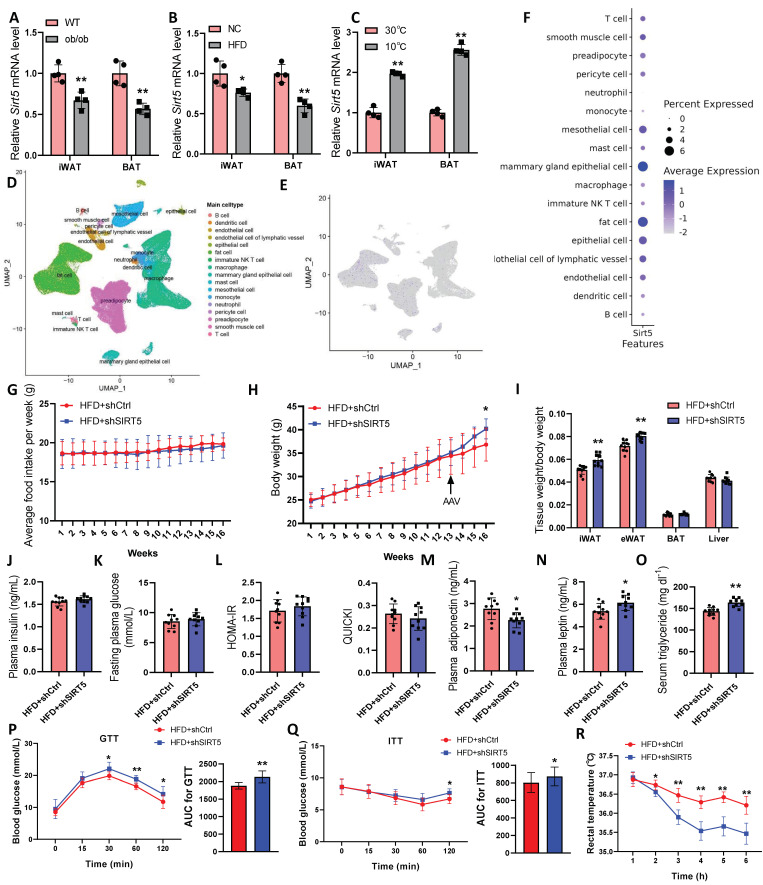
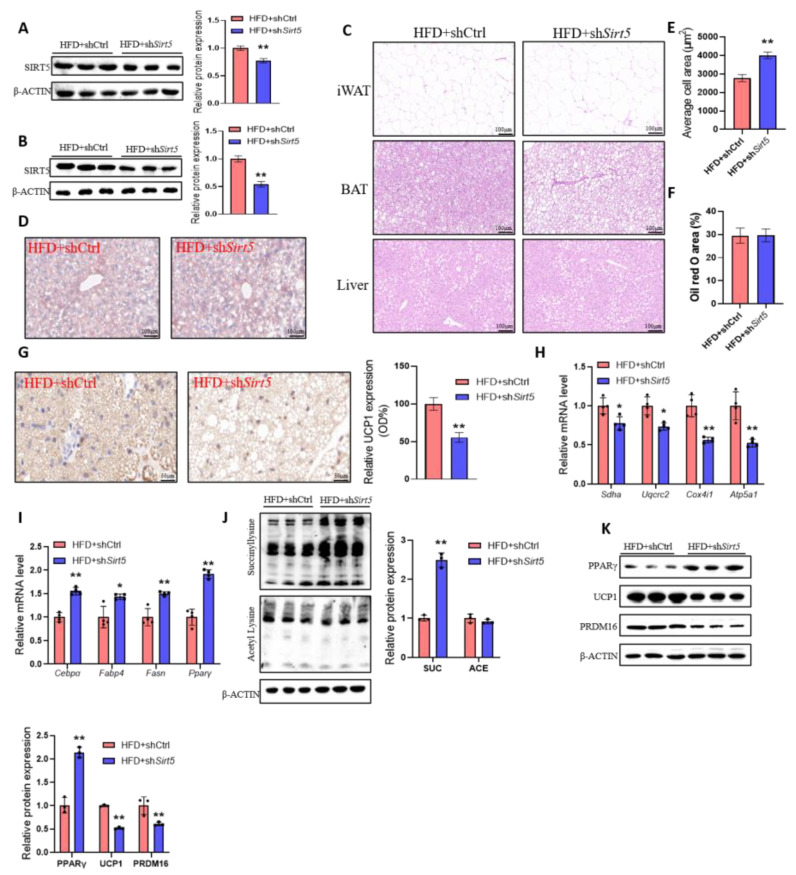
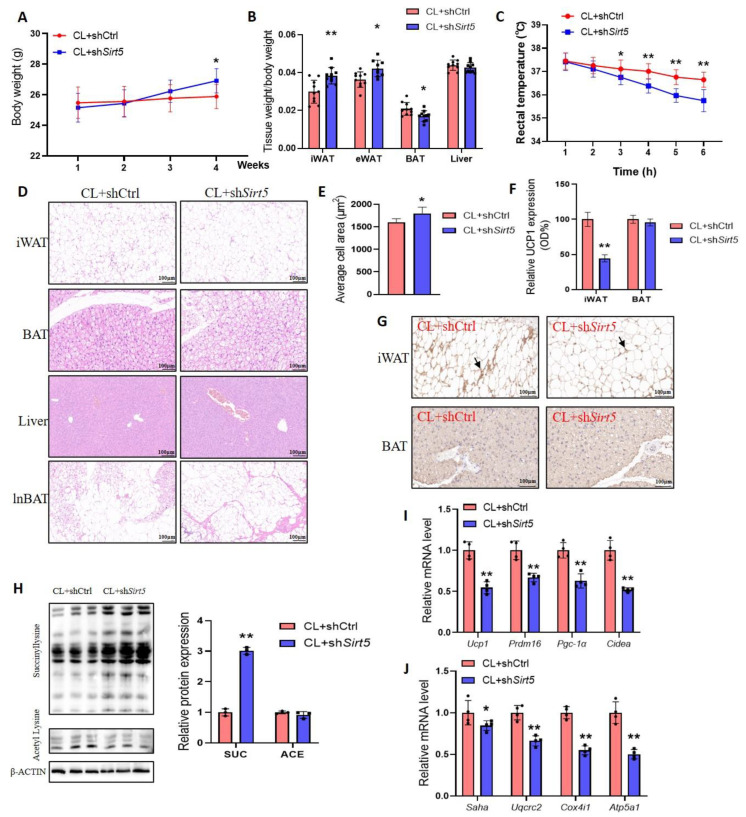
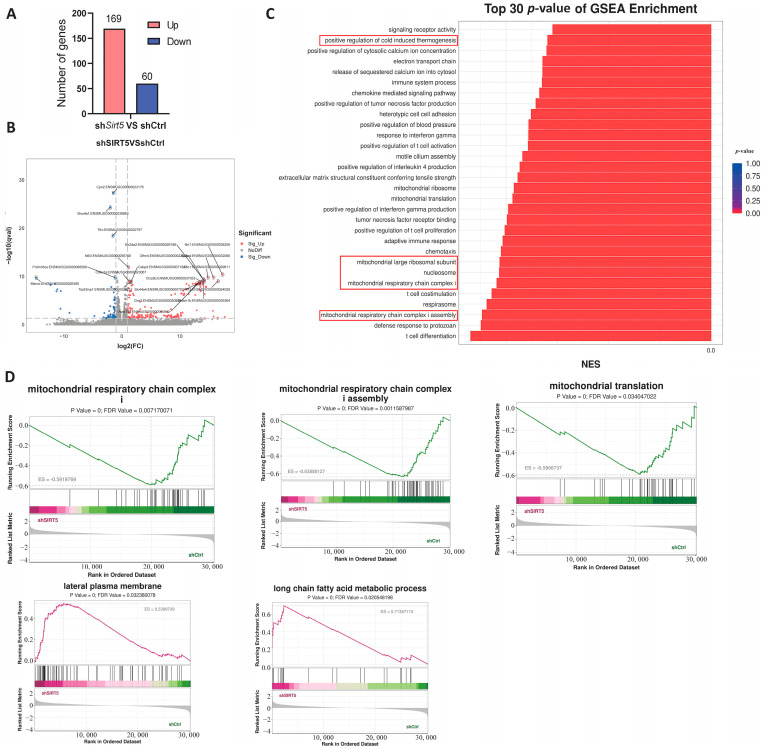
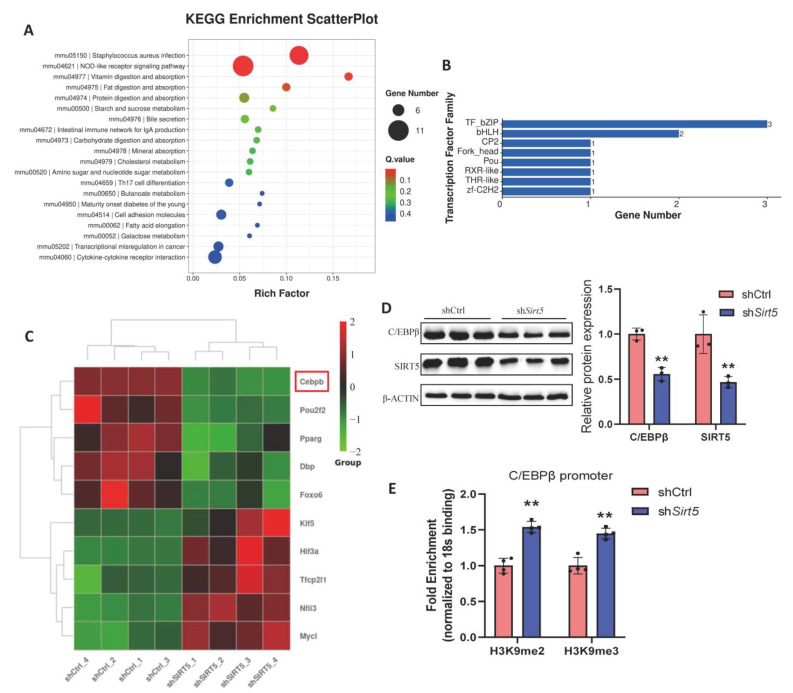
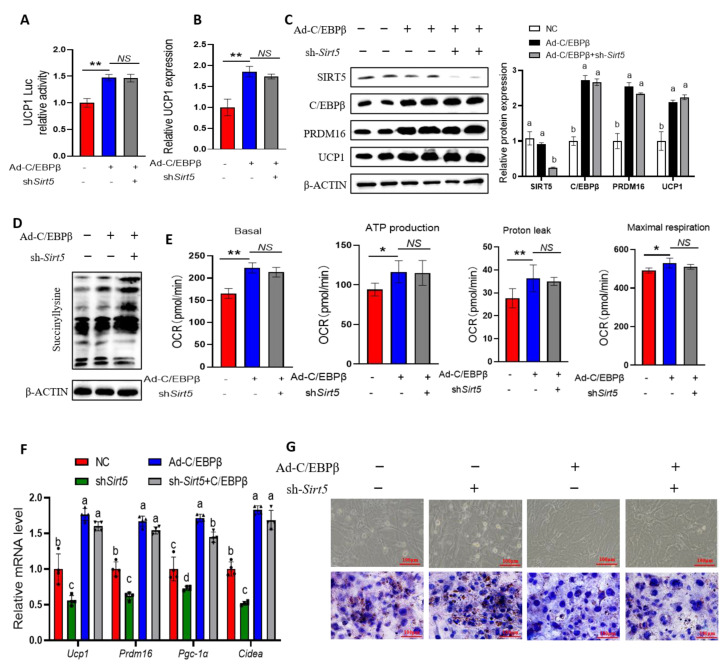
Sirtuin 5 (SIRT5) plays an important role in the maintenance of lipid metabolism and in white adipose tissue browning. In this study, we established a mouse model for diet-induced obesity and the browning of white fat; combined with gene expression intervention, transcriptome sequencing, and cell molecular biology methods, the regulation and molecular mechanisms of SIRT5 on fat deposition and beige fat formation were studied. The results showed that the loss of SIRT5 in obese mice exacerbated white adipose tissue deposition and metabolic inflexibility. Furthermore, the deletion of SIRT5 in a white-fat-browning mouse increased the succinylation of uncoupling protein 1 (UCP1), resulting in a loss of the beiging capacity of the subcutaneous white adipose tissue and impaired cold tolerance. Mechanistically, the inhibition of SIRT5 results in impaired CCAAT/enhancer binding protein beta (C/EBPβ) expression in brown adipocytes, which in turn reduces the UCP1 transcriptional pathway. Thus, the transcription of UCP1 mediated by the SIRT5-C/EBPβ axis is critical in regulating energy balance and obesity-related metabolism.

Keywords: SIRT5; UCP1; fat synthesis; protein succinylation; white adipose tissue browning.


Conflict of interest statement

The authors declare no conflict of interest.

Figures

Figure 1
Figure 1
Effects of SIRT5 on body weight and glucose and lipid metabolism in HFD-induced obese mice. (A,B): mRNA levels of Sirt5 in iWAT and BAT in ob/ob mice (A) or HFD-induced obese mice (B) (n = 4). (C): mRNA levels of Sirt5 in iWAT and BAT of mice stored at 30 °C or 10 °C for 10 days (n = 4). (DF): Analysis of Sirt5 expression in GSE176171 dataset. (G,H): Average weekly food intake (G) and body weight (H) of each mouse (n = 10). (I): Tissue weight/body weight of mice in each group (n = 10). (JO): Levels of insulin (J), glucose (K), HOMA-IR and QUICKI index (L), adiponectin (M), leptin (N), and triglyceride (O) in the blood of mice in each group (n = 10). (P,Q): GTT and ITT analysis of mice in each group (n = 10). (R): Rectal temperature of mice after acute exposure at different times (n = 10). HOMA-IR: homeostatic model assessment for insulin resistance; QUI-CKI: quantitative insulin sensitivity check index; AUC: area under the curve. * p < 0.05, ** p < 0.01, Student’s t-test (n ≥ 10), Mann–Whitney U test (n < 10).
Figure 2
Figure 2
Effect of SIRT5 deletion on HFD-induced adipogenesis and browning of white fat in mice. (A,B): The protein levels of SIRT5 in BAT (A) and iWAT (B) of mice in each group (n = 3). (C): H and E staining of iWAT, BAT, and liver of mice in each group (n = 3). (D): The livers of mice in each group were stained with oil red O (n = 3). (E): Average cell area of subcutaneous iWAT in each group. (F): The area of liver stained with oil red O in each group. (G): Immunohistochemical staining of UCP1 in BAT of mice in each group (n = 3). (H): mRNA levels of mitochondrial-complex-related genes in mouse BAT (n = 4). (I): mRNA levels of lipid-synthesis-related genes in mouse iWAT (n = 4). (J,K): Western blot of iWAT from each group of mice (n = 3). * p < 0.05, ** p < 0.01, Mann–Whitney U test.
Figure 3
Figure 3
Effect of SIRT5 knockdown on browning of white fat in mice. (A): Body weight of Sirt5 knockdown mice stimulated by CL (n = 10). (B): Tissue weight/body weight of mice in each group (n = 10). (C): Acute stimulation of rectal temperature in mice (n = 4). (D): H and E staining of iWAT, lnBAT, BAT, and liver of mice under the same treatment (n = 3). (E): Average cell area of subcutaneous iWAT in each group. (F,G): Immunohistochemical staining of UCP1 in iWAT and BAT of mice in each group (n = 3), arrows indicate detected UCP1. (H): Western blot of BAT from each group of mice (n = 3). (I,J): mRNA levels of mitochondrial-complex-related genes (I) and browning genes (J) in mouse BAT (n = 4). CL: CL316, 243; SUC: succinyllysine; ACE: acetylysine. * p < 0.05, ** p < 0.01, Mann–Whitney U test.
Figure 4
Figure 4
RNA-seq analysis of BAT in Sirt5 knockdown mice. (A): Different genes were significantly upregulated or downregulated in each group (n = 4). (B): Volcano map of differentially expressed genes. (C): Functional enrichment analysis of differentially expressed genes. (D): GSEA analysis of mice in each group.
Figure 5
Figure 5
Effect of Sirt5 knockdown on transcription factors in BAT of mice. (A): KEGG analysis of mice in each group. (B): The number and classification of different transcription factors in each group. (C): Heat map of differential transcription factors. (D): Immunoblot analysis of brown adipocytes in different treatments (n = 3). (E): Binding levels of h3k9me2 and h3k9me3 in the C/EBPβ promoter region (n = 4). ** p < 0.01, Mann–Whitney U test.
Figure 6
Figure 6
The activation of UCP1 transcription by SIRT5 is dependent on C/EBPβ. (A): Reporter analysis of C3H10T12 cells after Sirt5 knockdown and transfection with C/EBPβ vector (n = 3). (B): UCP1 expression in C3H10T12 cells transfected with C/EBPβ vector after SIRT5 knockdown (n = 3). (C,D): Immunoblot analysis of C3H10T12 cells treated with the same treatment. (E): Continuous measurement of oxygen consumption in C3H10T12 cells treated with the same treatment (n = 3). (F): The mRNA levels of thermogenic genes in C3H10T12 cells treated with the same treatment (n = 4). (G): Oil red O staining was performed on C3H10T12 cells under the same treatment. OCR: O2 consumption rate. * p < 0.05; ** p < 0.01; NS: not significantly different. Lowercase letters indicate statistical significance, and groups with different letters indicate p < 0.05.

Similar articles

Cited by

References

    1. Wang Q.A., Tao C., Gupta R.K., Scherer P.E. Tracking adipogenesis during white adipose tissue development, expansion and regeneration. Nat. Med. 2013;19:1338–1344. doi: 10.1038/nm.3324. - DOI - PMC - PubMed
    1. Heinonen S., Jokinen R., Rissanen A., Pietiläinen K.H. White adipose tissue mitochondrial metabolism in health and in obesity. Obes. Rev. 2020;21:e12958. doi: 10.1111/obr.12958. - DOI - PubMed
    1. Wang W., Seale P. Control of brown and beige fat development. Nat. Rev. Mol. Cell Biol. 2016;17:691–702. doi: 10.1038/nrm.2016.96. - DOI - PMC - PubMed
    1. Harms M., Seale P. Brown and beige fat: Development, function and therapeutic potential. Nat. Med. 2013;19:1252–1263. doi: 10.1038/nm.3361. - DOI - PubMed
    1. Oguri Y., Shinoda K., Kim H., Alba D.L., Bolus W.R., Wang Q., Brown Z., Pradhan R.N., Tajima K., Yoneshiro T., et al. CD81 Controls Beige Fat Progenitor Cell Growth and Energy Balance via FAK Signaling. Cell. 2020;182:563–577.e520. doi: 10.1016/j.cell.2020.06.021. - DOI - PMC - PubMed

LinkOut - more resources