. 2024 Oct 2;25(19):10616.
doi: 10.3390/ijms251910616.

Exploring a Potential Optimization Route for Peptide Ligands of the Sam Domain from the Lipid Phosphatase Ship2

Affiliations

Exploring a Potential Optimization Route for Peptide Ligands of the Sam Domain from the Lipid Phosphatase Ship2

Marian Vincenzi et al. Int J Mol Sci. .

Abstract

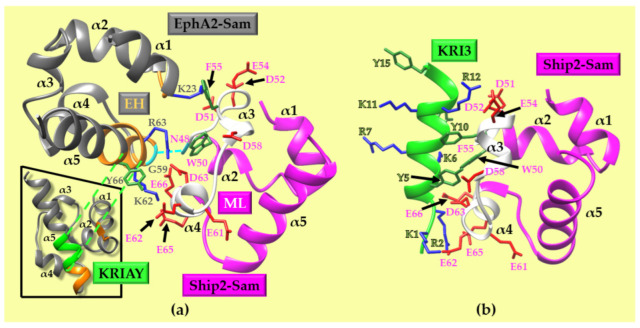
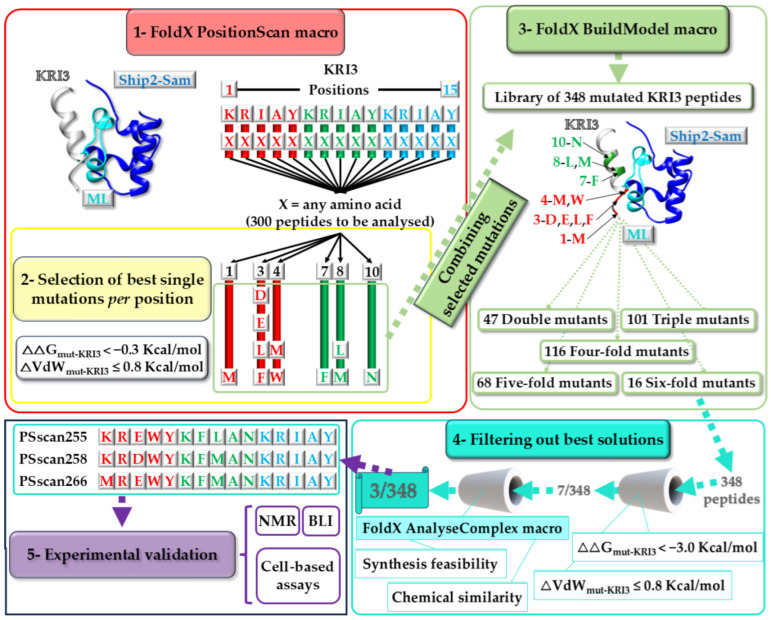
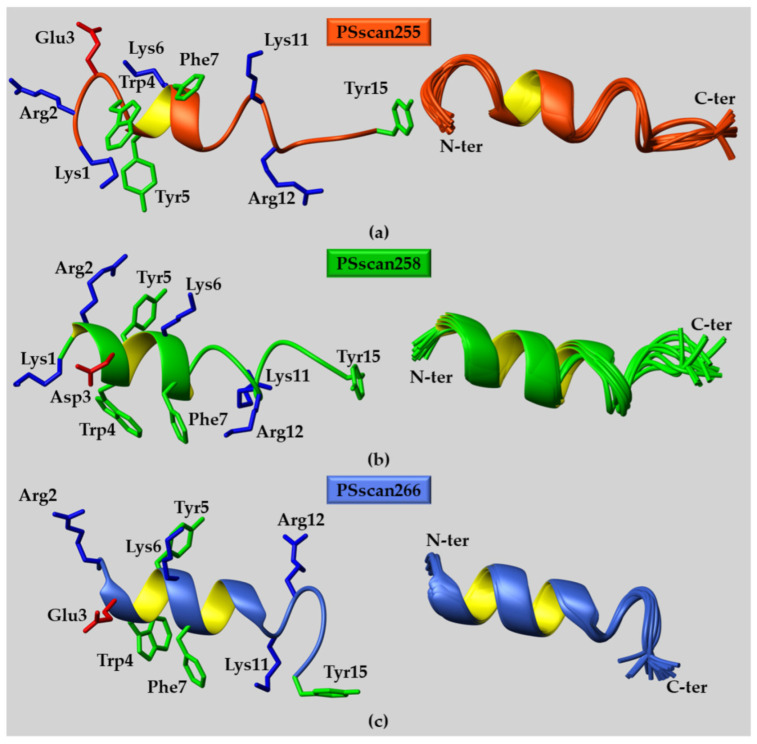
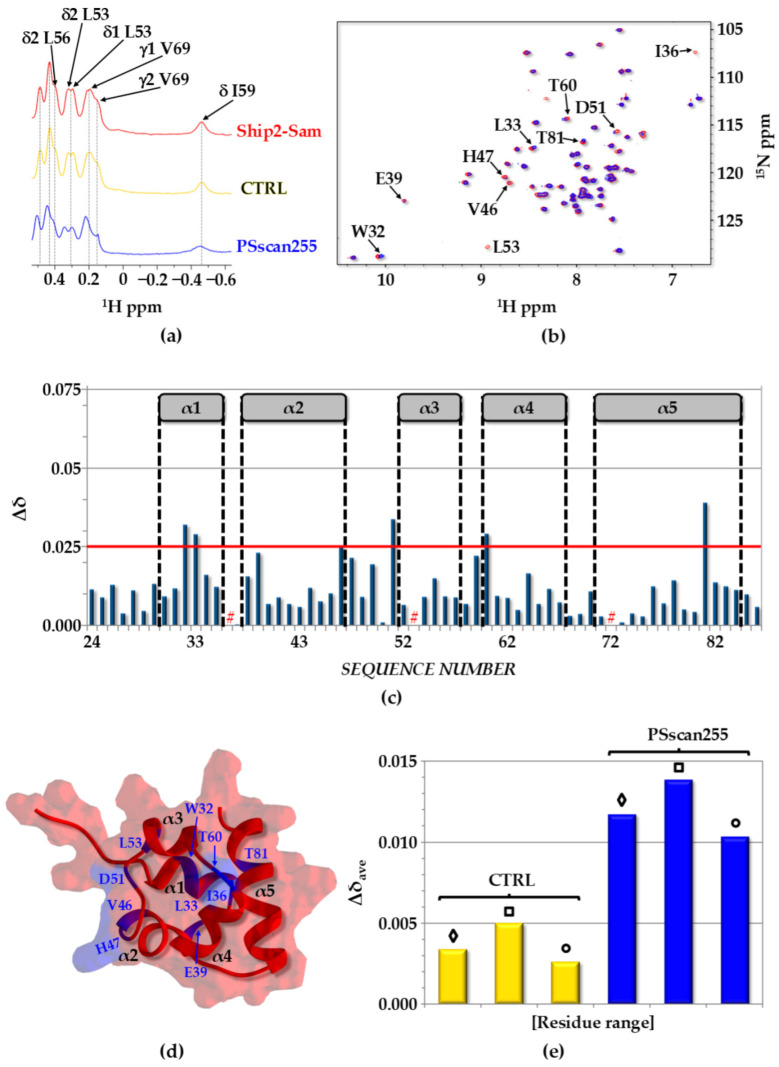
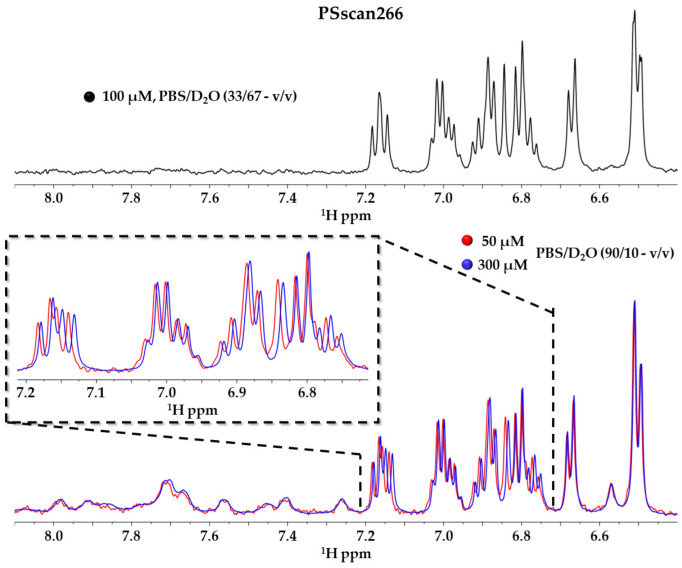
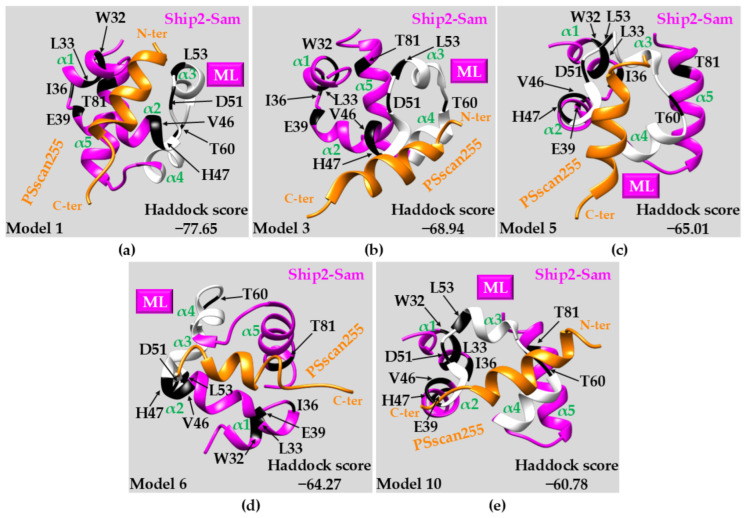
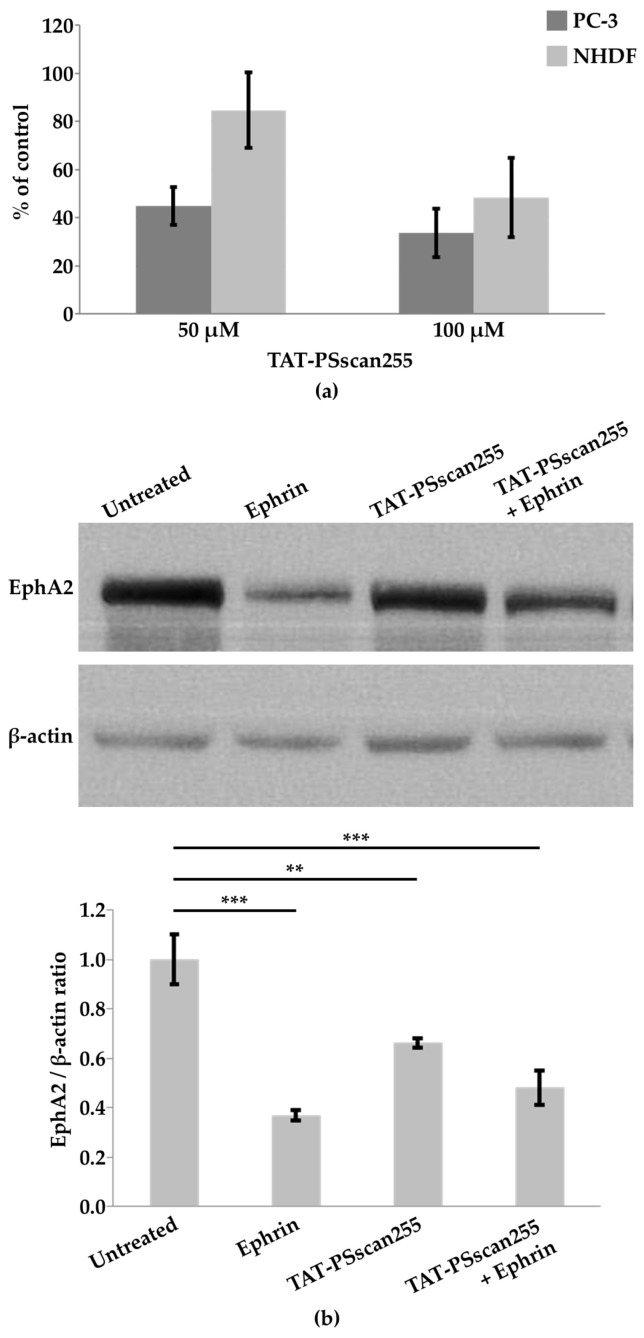
The Sam (Sterile alpha motif) domain of the lipid phosphatase Ship2 (Ship2-Sam) is engaged by the Sam domain of the receptor tyrosine kinase EphA2 (EphA2-Sam) and, this interaction is principally linked to procancer effects. Peptides able to hinder the formation of the EphA2-Sam/Ship2-Sam complex could possess therapeutic potential. Herein, by employing the FoldX software suite, we set up an in silico approach to improve the peptide targeting of the so-called Mid Loop interface of Ship2-Sam, representing the EphA2-Sam binding site. Starting from a formerly identified peptide antagonist of the EphA2-Sam/Ship2-Sam association, first, the most stabilizing mutations that could be inserted in each peptide position were predicted. Then, they were combined, producing a list of potentially enhanced Ship2-Sam ligands. A few of the in silico generated peptides were experimentally evaluated. Interaction assays with Ship2-Sam were performed using NMR and BLI (BioLayer Interferometry). In vitro assays were conducted as well to check for cytotoxic effects against both cancerous and healthy cells, and also to assess the capacity to regulate EphA2 degradation. This study undoubtedly enlarges our knowledge on how to properly target EphA2-Sam/Ship2-Sam associations with peptide-based tools and provides a promising strategy that can be used to target any protein-protein interaction.

Keywords: EphA2 receptor; Sam (Sterile alpha motif) domain; Ship2 lipid phosphatase; anticancer molecular tools; drug design; peptides.


Conflict of interest statement

M.L. and F.A.M. are co-guest editors of the special issue “New Insights into Bioactive Peptides: Design, Synthesis, Structure-Activity Relationship 2.0”.

Figures

Figure 1
Figure 1
(a) The EphA2-Sam (gray)/Ship2-Sam (magenta) hetero-dimer. The EphA2-Sam EH interface (regions P58-Y66 and I22-M24 from the chain A of the PDB entry code 2KSO [9]) and the Ship2-Sam ML interface (segment H47-E66 from the chain B of the PDB entry code 2KSO) are colored orange and white, respectively. The side chains of aromatic, positively, and negatively charged residues present at the Sam–Sam EH/ML interface are shown in dark green, blue, and red, respectively. Residues G59 (EphA2-Sam) and N48 (Ship2-Sam) involved in the Sam–Sam characteristic H-bond (G59 NH/N48 O [14]) are colored in cyan and highlighted by a connecting dashed line. The inset shows the position of the KRIAY motif (green) within the EH interface of EphA2-Sam. (b) The docking model of the Ship2-Sam/KRI3 peptide complex [32]. The color code used for Ship2-Sam, aromatic, positively charged, and negatively charged residues is the same as that in panel (a). KRI3 is shown in a light green ribbon representation, with the side chains of Lys (blue), Arg (blue), and Tyr (dark green) reported in a neon representation.
Figure 2
Figure 2
In silico design of peptide sequences through the different macros of FoldX (v. 5) [29]; the peptide selection strategy and the experimental in vitro evaluation protocol are also indicated.
Figure 3
Figure 3
NMR solution structures in PBS/TFE (50/50—v/v) of (a) PSscan255; (b) PSscan258; and (c) PSscan266 peptides. (ac) Representative NMR conformers are reported in the left panels in ribbon drawings, whereas superpositions on the backbone atoms of twenty structures are shown in the right panels. In the left panels, diverse charged and aromatic residues are evidenced in a neon representation with only heavy atoms. (a) PSscan255 conformers were calculated from 175 distance restraints (52 intra-residue, 53 short-, 70 medium-, and 0 long-range) and 81 angle constraints; (b) regarding PSscan258, 159 distance restraints (50 intra-residue, 57 short-, 52 medium-, and 0 long-range) along with 83 angle constraints were employed to derive the NMR structure; (c) the PSscan266 structure was calculated based on 177 distance restraints (74 intra-residue, 54 short-, 49 medium-, and 0 long-range) and 81 angle constraints.
Figure 4
Figure 4
(a) Screening by 1D [1H] NMR. The expansion of aliphatic regions of 1D [1H] NMR spectra of Ship2-Sam in the apo form (27 µM concentration) (red) and in the presence of the different peptides (273 µM each). (b) Comparison of [1H-15N] HSQC spectra of Ship2-Sam (20 μM concentration) alone (red) and after the addition of the PSscan255 peptide (200 μM concentration) (blue). (c) Histogram showing chemical shift perturbations (CSPs) (i.e., Δδ = [(ΔHN)2 + (0.17 × Δ15NH)2]1/2) [49] versus residue numbers for the interaction between Ship2-Sam and PSScan255. The Δδ value was set to be equal to zero for P72 as well as I36 and L53 as their peaks disappear in the spectrum of the peptide/protein complex (See “#”). (d) Residues associated with the largest perturbations in chemical shifts (Δδ ≥ 0.025 ppm) or peak intensities (i.e., W32 (NHε1), L33, I36, E39, V46, H47, D51, L53, T60, T81) are highlighted in blue in the 3D solution structure of Ship2-Sam (conformer number 1, PDB entry code 2K4P [8]), which is displayed in the ribbon with a transparent surface drawing. (e) Average CSP (Δδave) values for control (CTRL) and PSscan255 peptides, which were evaluated for the entire Ship2-Sam sequence (“◊” residue range L24-K86), the ML interface (“□” protein segment H47-E66), and the region outside the ML (“○” residues L24-V46 and A67-K86). Peaks corresponding to backbone NH and side-chain NHε1 groups of W32 and W50 were included in the CSP evaluation.
Figure 5
Figure 5
The 1D [1H] spectrum (HN/aromatic protons regions) of PSscan266 (100 µM concentration) in PBS/D2O (33/67—v/v) (black) is shown on the top. The overlay of 1D [1H] NMR spectra, recorded in PBS/D2O (90/10—v/v) of PSscan266 peptide at 50 µM (red) and 300 µM (blue) concentrations, is shown on the bottom. An expansion containing only peaks arising from aromatic protons is reported in the left inset. Peak intensities were adjusted to reach the same level in each spectrum.
Figure 6
Figure 6
Docking results for the Ship2-Sam/PSscan255 peptide complex. In each panel, a different docking solution among the best 10—in terms of Haddock scores [50]—is shown. (a) 1st best model; (b) 3rd best model; (c) 5th best model; (d) 6th best model; (e) 10th best model. Each structure is reported in a ribbon representation: the ML region in Ship2-Sam (magenta) is colored white. The residues most affected by the binding of the peptide according to the NMR studies (i.e., W32 (NHε1), L33, I36, E39, V46, H47, D51, L53, T60, T81) are highlighted in black on the Ship2-Sam surface. The PSscan255 peptide is shown in an orange ribbon drawing. Different helices in Ship2-Sam are labeled.
Figure 7
Figure 7
(a) The cytotoxic effect of PSscan255 peptide on PC-3 and NHDF cells was assessed through the crystal violet assay. Cells were treated with TAT-PSscan255 (50 μM and 100 μM concentrations for 4 h), and values were expressed as percentages relative to untreated cells. Each value represents an average ± SEM (Standard Error of Mean) of three separate experiments performed in quadruplicate. (b) EphA2 degradation in the prostatic cancer cell line. (Top) PC-3 cells were treated either with TAT-PSscan255 (50 μM for 4 h) and/or ephrinA1-Fc (1 μg/mL for 2 h). The β-actin antibody was employed for the comparison of protein loads. Characteristic data are presented (bottom). EphA2/β-actin ratios were normalized, assuming the EphA2 expression under the untreated condition as 1. Mean ± SEM, n = 3. One-way analysis of variance (ANOVA) using Dunnett’s post-test analysis was performed; ** p< 0.01; *** p< 0.001.

Similar articles

References

    1. Vandeput F., Backers K., Villeret V., Pesesse X., Erneux C. The influence of anionic lipids on SHIP2 phosphatidylinositol 3,4,5-trisphosphate 5-phosphatase activity. Cell. Signal. 2006;18:2193–2199. doi: 10.1016/j.cellsig.2006.05.010. - DOI - PubMed
    1. Thomas M.P., Erneux C., Potter B.V. SHIP2: Structure, Function and Inhibition. ChemBioChem. 2017;18:233–247. doi: 10.1002/cbic.201600541. - DOI - PubMed
    1. Muller S.M., Jucker M. The Functional Roles of the Src Homology 2 Domain-Containing Inositol 5-Phosphatases SHIP1 and SHIP2 in the Pathogenesis of Human Diseases. Int. J. Mol. Sci. 2024;25:5254. doi: 10.3390/ijms25105254. - DOI - PMC - PubMed
    1. Rudge S.A., Wakelam M.J. Phosphatidylinositolphosphate phosphatase activities and cancer. J. Lipid Res. 2016;57:176–192. doi: 10.1194/jlr.R059154. - DOI - PMC - PubMed
    1. Pasquale E.B. Eph receptors and ephrins in cancer progression. Nat. Rev. Cancer. 2024;24:5–27. doi: 10.1038/s41568-023-00634-x. - DOI - PMC - PubMed

MeSH terms

LinkOut - more resources