. 2024 Oct 3;25(19):10651.
doi: 10.3390/ijms251910651.

Neutrophil Diversity (Immature, Aged, and Low-Density Neutrophils) and Functional Plasticity: Possible Impacts of Iron Overload in β-Thalassemia

Affiliations

Neutrophil Diversity (Immature, Aged, and Low-Density Neutrophils) and Functional Plasticity: Possible Impacts of Iron Overload in β-Thalassemia

Kritsanawan Sae-Khow et al. Int J Mol Sci. .

Abstract

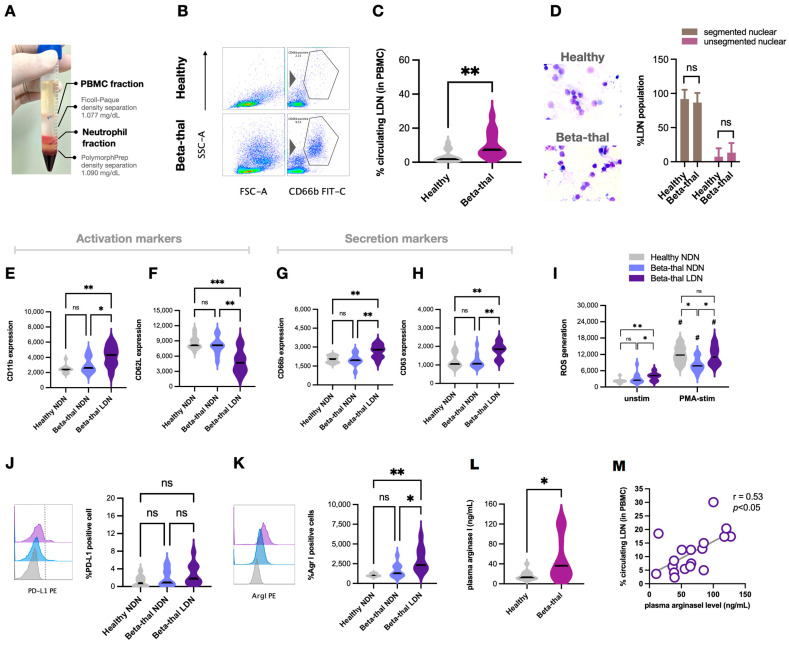
Neutrophil dysfunction is a form of immune suppression in patients with β-thalassemia (Beta-thal), although data on this are limited. In this study, blood from patients and healthy volunteers was analyzed. Flow cytometry analysis demonstrated an increase in immature neutrophils (CD16- CD62L+) and aged (senescent) neutrophils (CD16+ CD62L-) in Beta-thal patients compared to healthy volunteers. The Beta-thal neutrophils demonstrated less prominent chemotaxis and phagocytosis than healthy neutrophils at the baseline. With phorbol myristate acetate (PMA) or lipopolysaccharide (LPS) stimulations, some of the indicators, including the flow cytometry markers (CD11b, CD62L, CD66b, CD63, apoptosis, and reactive oxygen species) and neutrophil extracellular traps (NETs; detected by anti-citrullinated histone 3 immunofluorescence), were lower than the control. Additionally, low-density neutrophils (LDNs), which are found in the peripheral blood mononuclear cell (PBMC) fraction, were observed in Beta-thal patients but not in the control group. The expression of CD11b, CD66b, CD63, arginase I, and ROS in LDNs was higher than the regular normal-density neutrophils (NDNs). The proliferation rate of CD3+ T cells isolated from the PBMC fraction of healthy volunteers was higher than that of the cells from patients with Beta-thal. The incubation of red blood cell (RBC) lysate plus ferric ions with healthy NDNs transformed the NDNs into the aged neutrophils (decreased CD62L) and LDNs. In conclusion, iron overload induces neutrophil diversity along with some dysfunctions.

Keywords: iron overload; low-density neutrophils; neutrophil diversity; thalassemia.


Conflict of interest statement

The authors declare no conflicts of interest.

Figures

Figure 1
Figure 1
Elevated immature and aged neutrophils with some different characteristics in β-thalassemia compared with healthy controls. Scheme of the pattern of flow cytometry analysis started from neutrophil fraction (density gradient separation) (more than 95% of CD66b-positive cells) using CD16 and CD62L to separate into immature neutrophils (CD16− CD62L+), mature neutrophils (CD16+ CD62L+), and aged neutrophils (CD16+ CD62L−), and aged neutrophils were further tested by CD184 (a biomarker of CXCR4) (A). Abundance of mature neutrophils (light gray), immature neutrophils (dark gray), and aged neutrophils (purple color) in healthy controls and patients with β-thalassemia using flow cytometry analysis (B) together with an abundance of mature neutrophils (multi-segmented cells) and immature cells (band form) using conventional Wright’s stain (with the representative Wright’s stain pictures) (C) are demonstrated (n = 23 for patients with β-thalassemia and n = 20 for healthy control). For cell function analysis, the expression of CD11b (β-integrin), anti-CD62L (L-selectin), CD66b (carcinoembryonic antigen-related cell adhesion molecule 8 or CEACAM8), and CD63 (Tetraspanin) of neutrophils from healthy controls (gray color) and patients with β-thalassemia (purple color) after stimulation by phorbol myristate acetate (PMA; a neutrophil activator) or lipopolysaccharide (LPS; a potent pro-inflammatory stimulator) or unstimulated cells (unstim) with representative pictures of flow cytometry patterns (DH) are demonstrated (n = 23/group for unstim, PMA, and LPS). *, p < 0.05 for figure B; #, p < 0.05 vs. unstim neutrophils from healthy controls; ns, non-significance.
Figure 2
Figure 2
Different characteristics of β-thalassemic neutrophils compared with healthy neutrophils. Characteristics of neutrophils from patients with β-thalassemia (Beta-thal) or from healthy controls (Healthy) without stimulation (unstimulated cells) (unstim) or stimulation with phorbol myristate acetate (PMA; a neutrophil activator) or lipopolysaccharide (LPS; a potent pro-inflammatory stimulator) or calcium ionophore (Ca iono; an inducer for neutrophil extracellular traps (NETs)) as indicated by chemotaxis (A), phagocytosis (B), production of reactive oxygen species (ROS) (C), NET formation with representative immunofluorescent pictures using anti-citrullinated histone H3 (CitH3) (green color) and 4′,6-diamidino-2-phenylindole (DAPI; a nucleus staining color) (D,E), and apoptosis (F) are demonstrated (n = 23 for patients with β-thalassemia and n = 20 for healthy controls) (*, p < 0.05 for figure (AC); #, p < 0.05 vs. unstim neutrophils from healthy controls; ns, non-significance). Heat map of the r-square (r2) values (coefficient of determination) calculated by Spearman’s rank correlation coefficient of β-thalassemic neutrophils (unstimulating or stimulation with PMA or LPS) between the x-axis of percentage of different neutrophils, including immature (CD16− CD62L+), aged (CD16+ CD62L−), and combined cells (immature plus aged cells), versus functional parameters in the y-axis to demonstrate directions of the responses (red and blue colors are positive and negative correlation, respectively, and the $ sign indicates significant correlation at p < 0.05) (G) are shown (n = 23 for immature or aged neutrophils and n = 46 for combined immature plus aged cells).
Figure 3
Figure 3
Elevated low-density neutrophils (LDNs) with some different characteristics of β-thalassemia LDNs compared with normal-density neutrophils (NDNs). A representative picture of density-gradient separation demonstrated the fractions of polymorphonuclear cells (PBMCs) and neutrophils at the upper part of Ficoll-paque and between Ficoll-paque and PolymorphPrep, respectively, (A) and the representative pictures of flow cytometry analysis from the PBMC fraction from patients with β-thalassemia (Beta-thal) and healthy volunteers (Healthy) (B) with an abundance of low-density neutrophils (LDNs; neutrophils in the PBMC fraction) using flow cytometry analysis (C), and Wright’s stain (conventional light microscope) with representative staining pictures (D) are demonstrated (n = 18–23/group). Flow cytometry analysis of regular normal density neutrophils (the neutrophil fraction of density gradient separation) from patients (Beta-thal NDN) and controls (healthy NDN) versus beta-thal LDNs as indicated by activation markers (CD11b and CD62L) (E,F), secretory markers (CD66b and CD63) (G,H), reactive oxygen species (ROS) production (an alteration in fluorescent signaling in dihydroethidium-loaded cells) with and without stimulation of phorbol myristate acetate (PMA) (I), PD-L1 (J), and arginase I expression (K) are demonstrated (n = 18–23/group). Levels of plasma arginase I from patients and healthy controls (L) together with the correlation between percentage of LDNs and plasma arginase level of patients (M) are also shown (n = 18–23/group). *, p < 0.05; **, p < 0.01; ***, p < 0.001; #, p < 0.05; ns, non-significance.
Figure 4
Figure 4
Reduced T cell proliferation in patients with β-thalassemia compared with healthy controls. The abundance of total peripheral blood CD3+ T cells, T helper (Th) cells (CD3+ CD4+), and cytotoxic (Tc) cells (CD3+ CD8+), with representative flow cytometry patterns from patients with β-thalassemia (Beta-thal) and healthy volunteers (Healthy) (AC), is demonstrated (n = 16–20/group). Additionally, the CD3+ proliferation rate using carboxyfluorescein succinimidyl ester (CFSE) assay of CD3+ T cells isolated from the peripheral blood (isolated CD3) or peripheral blood mononuclear cell fraction (PBMC) from Beta-thal and Healthy groups (D) is also shown (n = 16–20/group). *, p < 0.05; ns, non-significance.
Figure 5
Figure 5
Induction of low-density neutrophils (LDNs) from normal-density neutrophils (NDNs) of healthy controls and differences between iron activation in LDNs and NDNs. Schema of flow cytometry analysis started from neutrophils from healthy volunteers (untreated) and the neutrophils incubated by red blood cells (RBCs) lysate alone or RBC lysate with ferric ions (Fe3+) (A) and abundance of mature neutrophils (CD16+ CD62L+), aged neutrophils (CD16+ CD62L−), and immature-liked neutrophils (CD16− CD62L+) (B) are demonstrated (the experimental group with ferric ions alone is not demonstrated due to similarity to the RBC lysate + Fe3+ group). The representative pictures of density gradient separation tubes with untreated neutrophils or neutrophils with RBC lysate alone or with ferric ions at the time before and after centrifugation to separate low-density neutrophils (LDNs) and normal-density neutrophils (NDNs) (C) with a graph presentation of the percentage of LDNs and NDNs in each experimental group (D) are also demonstrated. Function of untreated NDNs, NDNs with RBC lysate alone, or RBC lysate with ferric ions (RBC lysate+Fe3+) as determined by flow cytometry analysis using CD11b, CD66b, and CD63 (EG), chemotaxis activity (H), and percentage of neutrophil extracellular traps (NETs) using these neutrophils with or without phorbol myristate acetate (PMA) or lipopolysaccharide (LPS) (I) are shown. The data were retrieved from 5 independent experiments. *, p < 0.05; **, p < 0.01; ***, p < 0.001; ****, p < 0.0001, #, p < 0.05 vs. untreated unstimulated neutrophils; ns, non-significance.
Figure 6
Figure 6
The differences between low-density neutrophils (LDNs) from patients with β-thalassemia and LDNs from in vitro induction. The representative pictures of flow cytometry analysis using antibodies against CD16 and CD62L (upper part) together with CD184 (lower part) from LDNs of patients (LDNs from blood) (A) and induced LDNs from normal-density neutrophils (NDNs) (B) using red blood cell lysate plus ferric ions (LDNs from in vitro induction) are demonstrated.

Similar articles

Cited by

References

    1. Taher A.T., Weatherall D.J., Cappellini M.D. Thalassaemia. Lancet. 2018;391:155–167. doi: 10.1016/S0140-6736(17)31822-6. - DOI - PubMed
    1. Weatherall D.J. The inherited diseases of hemoglobin are an emerging global health burden. Blood. 2010;115:4331–4336. doi: 10.1182/blood-2010-01-251348. - DOI - PMC - PubMed
    1. Teawtrakul N., Jetsrisuparb A., Sirijerachai C., Chansung K., Wanitpongpun C. Severe bacterial infections in patients with non-transfusion-dependent thalassemia: Prevalence and clinical risk factors. Int. J. Infect. Dis. 2015;39:53–56. doi: 10.1016/j.ijid.2015.09.001. - DOI - PubMed
    1. Vento S., Cainelli F., Cesario F. Infections and thalassaemia. Lancet Infect. Dis. 2006;6:226–233. doi: 10.1016/S1473-3099(06)70437-6. - DOI - PubMed
    1. Sae-Khow K., Charoensappakit A., Visitchanakun P., Saisorn W., Svasti S., Fucharoen S., Leelahavanichkul A. Pathogen-Associated Molecules from Gut Translocation Enhance Severity of Cecal Ligation and Puncture Sepsis in Iron-Overload β-Thalassemia Mice. J. Inflamm. Res. 2020;13:719–735. doi: 10.2147/JIR.S273329. - DOI - PMC - PubMed

Substances

LinkOut - more resources