. 2024 Oct 3;25(19):10659.
doi: 10.3390/ijms251910659.

Trehalose Attenuates In Vitro Neurotoxicity of 6-Hydroxydopamine by Reducing Oxidative Stress and Activation of MAPK/AMPK Signaling Pathways

Affiliations

Trehalose Attenuates In Vitro Neurotoxicity of 6-Hydroxydopamine by Reducing Oxidative Stress and Activation of MAPK/AMPK Signaling Pathways

Danijela Stevanovic et al. Int J Mol Sci. .

Abstract

The effects of trehalose, an autophagy-inducing disaccharide with neuroprotective properties, on the neurotoxicity of parkinsonian mimetics 6-hydroxydopamine (6-OHDA) and 1-methyl-4-phenylpiridinium (MPP+) are poorly understood. In our study, trehalose suppressed 6-OHDA-induced caspase-3/PARP1 cleavage (detected by immunoblotting), apoptotic DNA fragmentation/phosphatidylserine externalization, oxidative stress, mitochondrial depolarization (flow cytometry), and mitochondrial damage (electron microscopy) in SH-SY5Y neuroblastoma cells. The protection was not mediated by autophagy, autophagic receptor p62, or antioxidant enzymes superoxide dismutase and catalase. Trehalose suppressed 6-OHDA-induced activation of c-Jun N-terminal kinase (JNK), p38 mitogen-activated protein kinase (MAPK), and AMP-activated protein kinase (AMPK), as revealed by immunoblotting. Pharmacological/genetic inhibition of JNK, p38 MAPK, or AMPK mimicked the trehalose-mediated cytoprotection. Trehalose did not affect the extracellular signal-regulated kinase (ERK) and mechanistic target of rapamycin complex 1 (mTORC1)/4EBP1 pathways, while it reduced the prosurvival mTORC2/AKT signaling. Finally, trehalose enhanced oxidative stress, mitochondrial damage, and apoptosis without decreasing JNK, p38 MAPK, AMPK, or AKT activation in SH-SY5Y cells exposed to MPP+. In conclusion, trehalose protects SH-SY5Y cells from 6-OHDA-induced oxidative stress, mitochondrial damage, and apoptosis through autophagy/p62-independent inhibition of JNK, p38 MAPK, and AMPK. The opposite effects of trehalose on the neurotoxicity of 6-OHDA and MPP+ suggest caution in its potential development as a neuroprotective agent.

Keywords: 6-hydroxydopamine; AMP-activated protein kinase; JNK; MPP+; Parkinson’s disease; mitochondrial damage; oxidative stress; p38 MAPK; trehalose.


Conflict of interest statement

The authors declare no conflicts of interest.

Figures

Figure 1
Figure 1
Trehalose inhibits 6-OHDA toxicity in SH-SY5Y cells. (ac) SH-SY5Y cells were incubated with or without 50 mM (a) or 100 mM (ac) of trehalose (TRE) for 24 h (a,c) or the indicated times (b), and then treated or not with 60 µM (ac) or 120 µM (a) of 6-OHDA for another 24 h. (a) Cell viability was determined by crystal violet (CV) and MTT assays, and the cytotoxicity was assessed by LDH release (a,b). The data are mean ± SD values from three independent experiments (a) or mean ± SD values of triplicate measurements from a representative of two experiments (b) (* p < 0.05 vs. no treatment; # p < 0.05 vs. 6-OHDA). Cell shape and numbers were examined by light microscopy (40×), and the representative light micrographs from three independent experiments are shown (c).
Figure 2
Figure 2
Experimental design for exploring the mechanisms of trehalose-mediated cytoprotection. After 24 h preincubation with trehalose (100 mM), SH-SY5Y cells were treated with 6-OHDA (60 µM). The autoxidation of 6-OHDA was measured in a cell-free system. MAPK/AMPK/mTORC1/2 signaling, autophagy (LC3, p62), oxidative stress/antioxidant defense (6-OHDA autoxidation, intracellular ROS, SOD, CAT, MAO), mitochondrial membrane potential (Δψ), autophagic/apoptotic ultrastructural morphology (autophagic vesicles, mitochondrial/nuclear morphology), apoptotic markers (caspase-3, PARP1, phosphatidylserine externalization, DNA fragmentation), and cell viability/cytotoxicity were assessed at the indicated time points. CAT, catalase; PARP1, poly (ADP-ribose) polymerase 1; ROS, reactive oxygen species; SOD, superoxide dismutase.
Figure 3
Figure 3
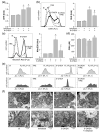
Trehalose inhibits 6-OHDA-induced apoptosis of SH-SY5Y cells. (ad) SH-SY5Y cells were incubated with or without trehalose (100 mM) for 24 h and then treated or not with 6-OHDA (60 µM) for another 16 h (a), 24 h (b,c), or the indicated times (d). TEM visualization of the ultrastructural morphology shows an apoptotic cell with condensed chromatin but intact cell membrane (white asterisk) and a cell with membrane damage undergoing secondary necrosis (white circle) in 6-OHDA-, but not 6-OHDA + trehalose-treated cells (a). Phosphatidylserine externalization (b) and DNA fragmentation (c) were assessed by flow cytometric analysis of annexin/PI and PI-stained cells, respectively. PARP1 cleavage and caspase-3 activation were analyzed by immunoblotting, with densitometry values below the relevant bands (mean ± SD, n = 3; * p < 0.05 vs. 6-OHDA) (d). The representative TEM images (a), flow cytometry histograms (b,c), and immunoblots (d) from two (ac) or three (d) independent experiments are shown.
Figure 4
Figure 4
Trehalose prevents 6-OHDA-induced oxidative stress and mitochondrial damage in SH-SY5Y cells. (a) Cell-free complete cell culture medium with or without trehalose (100 mM) was incubated in cell-culturing conditions for 24 h. Then, 6-OHDA (60 µM) was added for the next 1 h, and ROS levels were determined by measuring DHR fluorescence. (bf) SH-SY5Y cells were incubated with or without trehalose (TRE; 100 mM) for 24 h and then exposed or not to 6-OHDA (60 µM) for another 8 h. Intracellular ROS production (b), mitochondrial superoxide production (c), and mitochondrial depolarization (e) were determined by flow cytometric analysis of DHR-, MitoSOX- and JC-1-stained cells, respectively. Total reduced glutathione (GSH) was determined colorimetrically (d), while mitochondrial morphology was analyzed by TEM (black and white arrows showing normal and damaged mitochondria, respectively) (f). The data are mean ± SD values from three (a,c) or four (b) independent experiments, or mean ± SD values of triplicate measurements from a representative of two experiments (d) (* p < 0.05 vs. no treatment; # p < 0.05 vs. 6-OHDA). The representative histograms (b,c,e) or electron micrographs (f) are shown.
Figure 5
Figure 5
Trehalose-induced autophagy is not involved in protection from 6-OHDA. (ad) SH-SY5Y cells were incubated with or without trehalose (100 mM) for 24 h and then treated or not with 6-OHDA (60 µM) for 8 h (a,c), the indicated times (b), or 24 h (d), in the presence or absence of chloroquine (CQ; 20 µM) (c,d), 3-methyladenine (3MA; 4 mM), bafilomycin A1 (BAF; 10 nM), or NH4Cl (10 mM) (d). The presence of autophagic vesicles was analyzed by TEM, showing double-membrane autophagosomes (white arrowhead) and single-membrane autolysosomes with cellular debris (white arrows), including mitochondria (black arrow) in 6-OHDA and/or trehalose-treated cells (a). The LC3 conversion was assessed by immunoblotting and quantified by densitometry (b,c), and the cytotoxicity was determined by LDH assay (d). The data in (bd) are mean ± SD values from three independent experiments (* p < 0.05 vs. no treatment; # p < 0.05 vs. 6-OHDA; & p < 0.05 vs. 6-OHDA + trehalose). The representative TEM images (a) or immunoblots (b,c) from two (a) or three (b,c) independent experiments are shown.
Figure 6
Figure 6
SOD1, catalase, MAO-A, and p62 are not involved in trehalose-mediated protection from 6-OHDA. (ad) SH-SY5Y cells were incubated with or without trehalose (100 mM) for 24 h and then treated or not with 6-OHDA (60 µM) for the indicated times (ac) or 6 h (e), or chloroquine (CQ; 20 µM) for 6 h (d). The protein levels of SOD1, catalase (a), MAO-A (b), and p62 (c,d) were assessed by immunoblotting and quantified by densitometry. The levels of p62 mRNA were analyzed by RT-qPCR (e). (f) SH-SY5Y cells transfected with control or p62 siRNA were incubated with or without trehalose (100 mM) for 24 h and then treated or not with 6-OHDA (60 µM) for another 24 h. The inset shows a p62 decrease by siRNA. Cell viability was determined by crystal violet (CV) and MTT assays, and the cytotoxicity was assessed by LDH release. The data in (af) are mean ± SD values from three independent experiments (* p < 0.05 vs. no treatment; # p < 0.05 vs. 6-OHDA). The representative immunoblots are shown in (ad,f).
Figure 7
Figure 7
Trehalose inhibits 6-OHDA-induced activation of JNK, p38, and AMPK. (af) SH-SY5Y cells were incubated with or without trehalose (100 mM) and then treated or not with 6-OHDA (60 µM) for another 2 or 6 h. The levels of phosphorylated and total forms of JNK (a), p38 MAPK (b), ERK (c), AMPK (d), AKT (e), and 4EBP1 (f), together with loading controls (actin or tubulin), were assessed by immunoblotting, and the representative immunoblots are shown. Densitometry data are mean ± SD values from three independent experiments (* p < 0.05 vs. no treatment; # p < 0.05 vs. 6-OHDA).
Figure 8
Figure 8
Inhibition of JNK, p38 MAPK, and AMPK is involved in trehalose-mediated protection from 6-OHDA. (ac) SH-SY5Y cells were incubated with or without trehalose (100 mM) for 24 h and then treated or not with 6-OHDA (60 µM) for another 24 h, in the presence or absence of JNK inhibitor SP600125 (10 µM) (a), p38 MAPK inhibitor SB203580 (10 µM) (b), or AMPK inhibitor compound C (2 µM) (c). Cell viability was determined by crystal violet (CV) and MTT assays, and the cytotoxicity was evaluated by LDH release. The data are mean ± SD values of triplicate measurements from a representative of three experiments (* p < 0.05 vs. no treatment; # p < 0.05 vs. 6-OHDA; & p < 0.05 vs. 6-OHDA + trehalose).
Figure 9
Figure 9
Trehalose increases MPP+-induced oxidative stress, mitochondrial damage, and apoptosis in SH-SY5Y cells. (ae) SH-SY5Y cells were incubated with or without trehalose (TRE; 100 mM) for 24 h and then treated or not with the indicated doses (a) or 4 mM MPP+ (be) for 24 h (a,b), 8 h (d,e), or the indicated times (c). Cell viability was determined by crystal violet (CV) and MTT assays, and the cytotoxicity was assessed by LDH release (mean ± SD, n = 3; * p < 0.05 vs. no treatment; # p < 0.05 vs. MPP+) (a). DNA fragmentation was measured by flow cytometric analysis of PI-stained cells (b), and caspase-3 activation was analyzed by immunoblotting, with densitometry values below the relevant bands (mean ± SD, n = 3; * p < 0.05 vs. MPP+) (c). Intracellular ROS production was quantified by flow cytometric analysis of MitoSOX-stained cells (d). Mitochondrial morphology was visualized by TEM, showing normal mitochondria (black arrows), elongated mitochondria with partial cristolysis (white arrowhead), and swollen mitochondria with fragmented cristae (white arrows) (e). The representative flow cytometry histograms (b,d), immunoblots (c), and TEM images (e) from two (b,d,e) or three (c) independent experiments are shown.
Figure 10
Figure 10
The effects of trehalose on MAPK/AMPK and AKT signaling in MPP+-treated SH-SY5Y cells. (ad) SH-SY5Y cells were incubated with or without trehalose (TRE; 100 mM) and then treated or not with MPP+ (4 mM) for another 2 or 6 h. The levels of phosphorylated and total forms of JNK (a), p38 MAPK (b), AMPK (c), and AKT (d), together with loading controls (GAPDH or actin), were assessed by immunoblotting, and the representative immunoblots are shown. Densitometry data are mean ± SD values from three independent experiments (* p < 0.05 vs. no treatment; # p < 0.05 vs. MPP+).

Similar articles

References

    1. Muleiro Alvarez M., Cano-Herrera G., Osorio Martínez M.F., Vega Gonzales-Portillo J., Monroy G.R., Murguiondo Pérez R., Torres-Ríos J.A., van Tienhoven X.A., Garibaldi Bernot E.M., Esparza Salazar F., et al. A comprehensive approach to Parkinson’s disease: Addressing its molecular, clinical, and therapeutic aspects. Int. J. Mol. Sci. 2024;25:7183. doi: 10.3390/ijms25137183. - DOI - PMC - PubMed
    1. Thirugnanam T., Santhakumar K. Chemically induced models of Parkinson’s disease. Comp. Biochem. Physiol. C Toxicol. Pharmacol. 2022;252:109213. doi: 10.1016/j.cbpc.2021.109213. - DOI - PubMed
    1. Blum D., Torch S., Lambeng N., Nissou M., Benabid A.L., Sadoul R., Verna J.M. Molecular pathways involved in the neurotoxicity of 6-OHDA, dopamine and MPTP: Contribution to the apoptotic theory in Parkinson’s disease. Prog. Neurobiol. 2001;65:135–172. doi: 10.1016/S0301-0082(01)00003-X. - DOI - PubMed
    1. Kinet R., Dehay B. Pathogenic aspects and therapeutic avenues of autophagy in Parkinson’s disease. Cells. 2023;12:621. doi: 10.3390/cells12040621. - DOI - PMC - PubMed
    1. Lizama B.N., Chu C.T. Neuronal autophagy and mitophagy in Parkinson’s disease. Mol. Asp. Med. 2021;82:100972. doi: 10.1016/j.mam.2021.100972. - DOI - PMC - PubMed

MeSH terms

LinkOut - more resources