. 2024 Oct 4;25(19):10702.
doi: 10.3390/ijms251910702.

MiR-146a Is Mutually Regulated by High Glucose-Induced Oxidative Stress in Human Periodontal Ligament Cells

Affiliations

MiR-146a Is Mutually Regulated by High Glucose-Induced Oxidative Stress in Human Periodontal Ligament Cells

Chihiro Fumimoto et al. Int J Mol Sci. .

Abstract

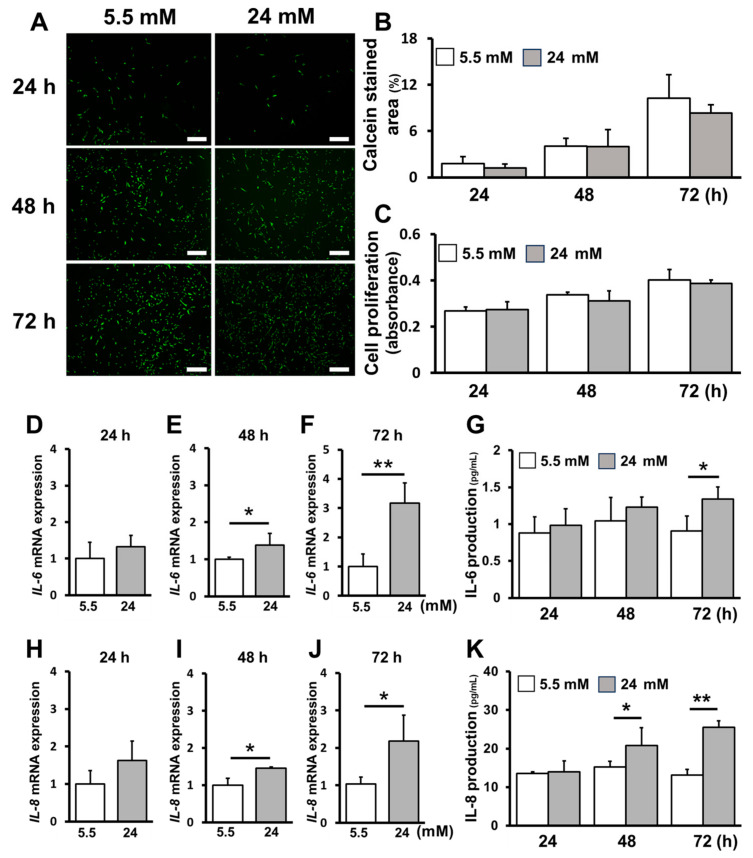
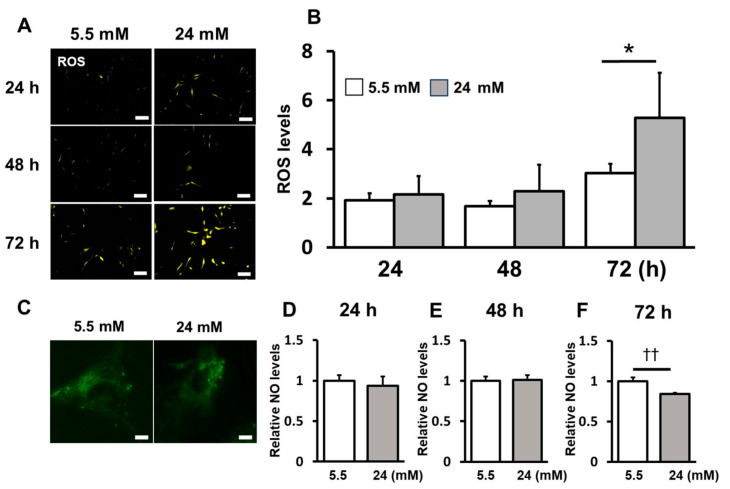
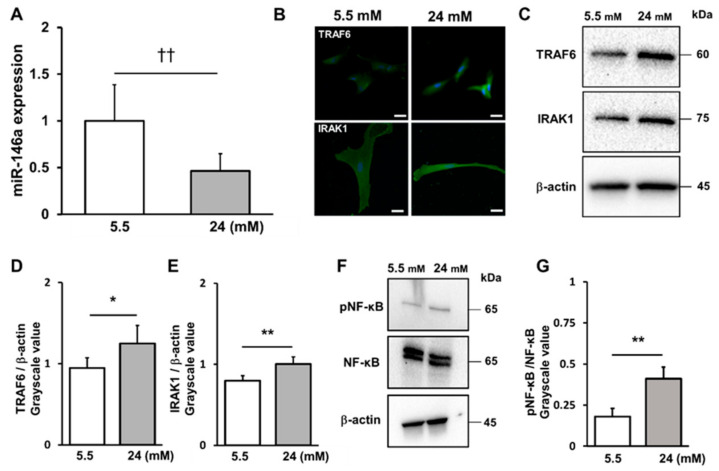
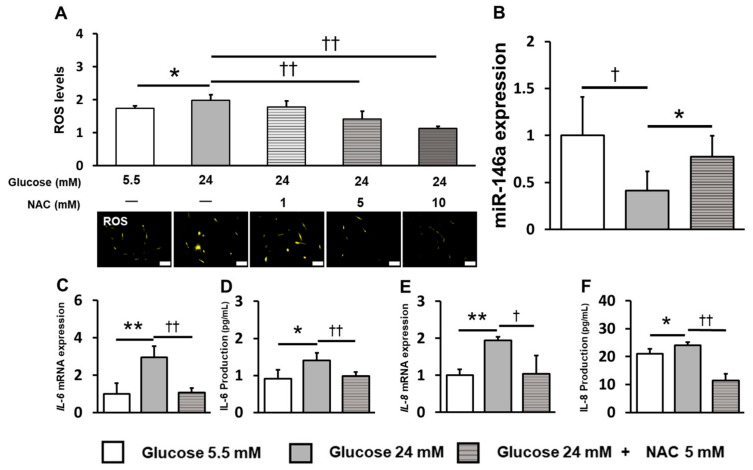
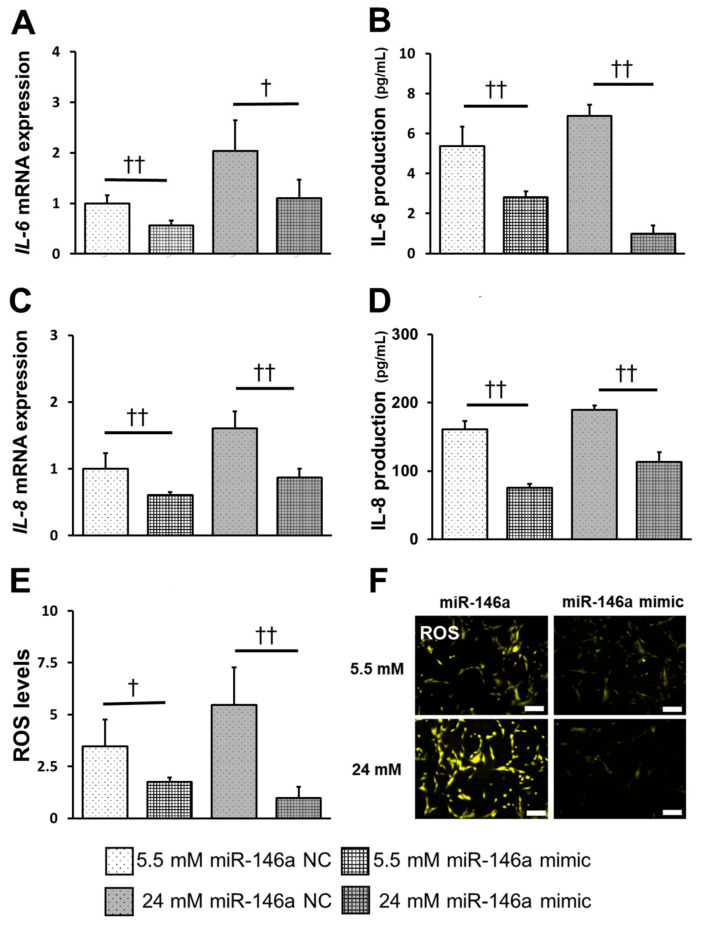
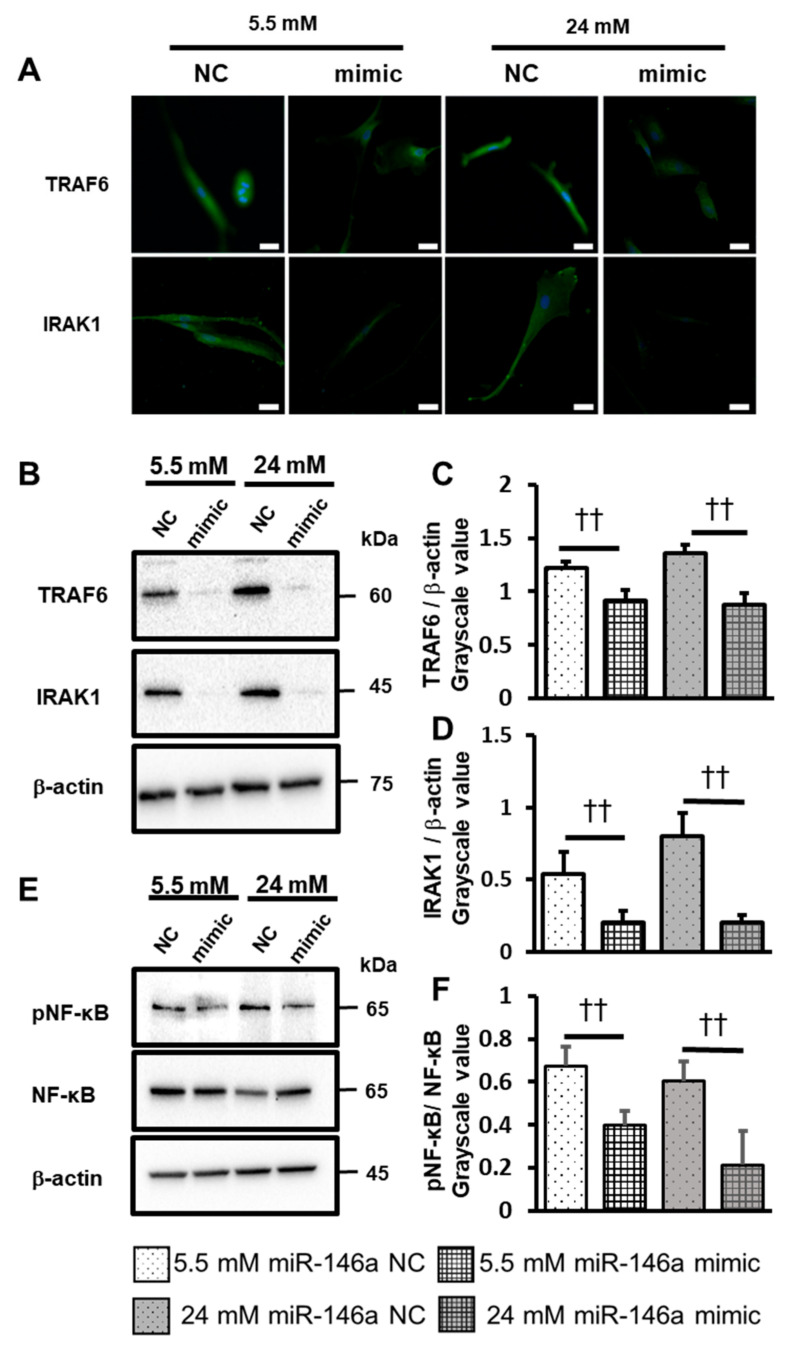
The high-glucose conditions caused by diabetes mellitus (DM) exert several effects on cells, including inflammation. miR-146a, a kind of miRNA, is involved in inflammation and may be regulated mutually with reactive oxygen species (ROS), which are produced under high-glucose conditions. In the present study, we used human periodontal ligament cells (hPDLCs) to determine the effects of the high-glucose conditions of miR-146a and their involvement in the regulation of oxidative stress and inflammatory cytokines using Western blotting, PCR, ELISA and other methods. When hPDLCs were subjected to high glucose (24 mM), cell proliferation was not affected; inflammatory cytokine expression, ROS induction, interleukin-1 receptor-associated kinase 1 (IRAK1) and TNF receptor-associated factor 6 (TRAF6) expression increased, but miR-146a expression decreased. Inhibition of ROS induction with the antioxidant N-acetyl-L-cysteine restored miR-146a expression and decreased inflammatory cytokine expression compared to those under high-glucose conditions. In addition, overexpression of miR-146a significantly suppressed the expression of the inflammatory cytokines IRAK1 and TRAF6, regardless of the glucose condition. Our findings suggest that oxidative stress and miR-146a expression are mutually regulated in hPDLCs under high-glucose conditions.

Keywords: ROS; hPDLCs; high glucose; miR-146a.


Conflict of interest statement

The authors declare that there are no conflicts of interest.

Figures

Figure 1
Figure 1
High glucose concentrations increase inflammatory cytokine production without affecting the proliferation of human periodontal ligament cells (hPDLCs). (A) hPDLCs stained with calcein-AM were imaged by a fluorescence microscope at 24, 48 and 72 h after incubation (scale bars: 500 μm). (B) The data for live cell staining are shown as the percentage of the area stained with calcein. (C) Cell proliferation was measured 24, 48 and 72 h after incubation. (DF) IL-6 mRNA gene expression was assessed at the point of 24, 48 and 72 h after stimulation. (G) IL-6 production was measured at 24, 48 and 72 h. (HJ) IL-8 mRNA gene expression was assessed at the point of 24, 48 and 72 h after stimulation. (K) IL-8 production was measured at the point of 24, 48 and 72 h after stimulation. Significant increase control: *p < 0.05, ** p < 0.01.
Figure 2
Figure 2
ROS induction was enhanced under high-glucose conditions. (A) The fluorescence intensity of ROS levels was measured using a plate reader and the data were compared to those of the control (scale bar: 200 μm). (B) Fluorescent staining was performed using a fluorescence microscope. (C) The mitochondria were stained after stimulation using MitoTracker (scale bar: 50 μm). (DF) NO production was measured using a Griess assay at 24, 48 and 72 h after stimulation. Significant increases compared with the control: * p < 0.05, ††p < 0.05.
Figure 3
Figure 3
High-glucose conditions decrease miR-146a expression and increase IRAK1, TRAF6 and NF-kB expression. (A) MiR-146a expression was measured at 72 h. (B) Immunofluorescence staining of IRAK1 and TRAF6 was visualized by confocal laser microscopy after 72 h of incubation (scale bar: 50 μm). (C) The levels of IRAK1 and TRAF6 were analyzed using Western blotting. Western blotting was performed on protein extracts of these cells with antibodies against the indicated proteins, using β-actin as a loading control. (D) TRAF6 expression was quantified using ImageJ software. (E) IRAK1 expression was quantified using ImageJ software (version 1.53e). (F) NF-kB and pNF-kB were analyzed using Western blotting. Western blotting was performed on protein extracts of these cells with antibodies against the indicated proteins, using β-actin as a loading control. (G) NF-kB and pNF-kB expression was quantified using ImageJ software. Significant increases compared with the control: * p < 0.05, ** p < 0.01. Significant decreases compared with those at 5.5 mM: †† p < 0.01.
Figure 4
Figure 4
MiR-146a expression and inflammatory cytokine production of hPDLCs are controlled by the production of ROS, which is influenced by NAC. NAC (1, 5 and 10 mM) was added to the medium, and ROS levels were examined under a high glucose concentration. (A) Fluorescence staining was performed using a fluorescence microscope. Fluorescence intensity was measured using a microplate reader and the data were compared with those of the control (scale bar: 200 μm). Significant increases were observed compared with those at 5.5 mM glucose: * p < 0.05. Significant decreases were observed compared with those at 24 mM glucose: ††p < 0.01. (B) Expression of miR-146a was measured at 72 h. (C) IL-6 mRNA gene expression was measured at 72 h. (D) IL-6 production was measured at 72 h. (E) IL-8 mRNA gene expression was measured at 72 h. (F) IL-8 production was measured at 72 h. Significant increases were compared with those at 24 mM glucose: * p < 0.05, ** p < 0.01. Significant decreases were compared with those at 24 mM glucose: † p < 0.05, †† p < 0.01.
Figure 5
Figure 5
miR-146a down-regulates the inflammatory response and ROS induction in hPDLCs. (A,C) After 24 h of transfection, cultures were stimulated with 5.5 mM or 24 mM glucose. IL-6 and IL-8 mRNA expression was measured at 72 h post-stimulation. (B,D) After 24 h of transfection, cultures were stimulated with 5.5 mM or 24 mM glucose. IL-6 and IL-8 production was measured at 72 h post-stimulation. (E,F) After 24 h of transfection, cultures were stimulated with 5.5 mM or 24 mM glucose. Fluorescence staining was performed using a fluorescence microscope. Fluorescence intensity was measured using a microplate reader, and the data were compared with those of the control (scale bar: 200 μm). Significant decreases compared with miR-146a NC: † p < 0.05, †† p < 0.01.
Figure 6
Figure 6
MiR-146a down-regulates IRAK1, TRAF6 and NF-κB in hPDLCs. (A) After 24 h of transfection, cultures were stimulated with 5.5 mM or 24 mM glucose. Immunofluorescence staining of IRAK1 and TRAF6 was visualized by confocal laser microscopy after 72 h of incubation (scale bar: 50 μm). (B) After 24 h of transfection, cultures were stimulated with 5.5 mM or 24 mM glucose. The levels of IRAK1 and TRAF6 were analyzed using Western blotting. Western blotting was performed on the protein extracts of these cells with antibodies against the indicated proteins, using β-actin as a loading control. (C) IRAK1 expression was quantified using ImageJ software. (D) TRAF6 expression was quantified using ImageJ software. (E) After 24 h of transfection, cultures were stimulated with 5.5 mM or 24 mM glucose. The levels of NF-κB and pNF-κB were analyzed using Western blotting. Western blotting was performed on the protein extracts of these cells with antibodies against the indicated proteins, using β-actin as a loading control. (F) NF-κB and p-NF-κB expression was quantified using ImageJ software. Significant decreases compared with miR-146a NC: †† p < 0.01.

References

    1. Liang Y., Li J., Xiao H., He Y., Zhang L., Yan Y. Identification of stress-related microRNA biomarkers in type 2 diabetes mellitus: A systematic review and meta-analysis. J. Diabetes. 2018;12:633–644. doi: 10.1111/1753-0407.12643. - DOI - PubMed
    1. Nelson R.G., Shlossman M., Budding L.M., Pettitt D.J., Saad M.F., Genco R.J., Knowler W.C. Periodontal Disease and NIDDM in Pima Indians. Diabetes Care. 1990;13:836–840. doi: 10.2337/diacare.13.8.836. - DOI - PubMed
    1. Mealey B.L., Oates T.W., American Academy of Periodontology Diabetes Mellitus and Periodontal Diseases. J. Periodontol. 2006;77:1289–1303. doi: 10.1902/jop.2006.050459. - DOI - PubMed
    1. Sekiguchi N., Inoguchi T., Kobayashi K., Sonoda N., Nawata H. Erythropoietin attenuated high glucose-induced apoptosis in cultured human aortic endothelial cells. Biochem. Biophys. Res. Commun. 2005;334:218–222. doi: 10.1016/j.bbrc.2005.06.072. - DOI - PubMed
    1. Zhang B., Liu N., Shi H., Wu H., Gao Y., He H., Gu B., Liu H. High glucose microenvironments inhibit the proliferation and migration of bone mesenchymal stem cells by activating GSK3β. J. Bone Miner. Metab. 2015;34:140–150. doi: 10.1007/s00774-015-0662-6. - DOI - PubMed

MeSH terms

LinkOut - more resources