. 2024 Oct 5;25(19):10713.
doi: 10.3390/ijms251910713.

Metabolic Rate and Oxidative Stress as a Risk Factors in the Development of Colorectal Cancer

Affiliations

Metabolic Rate and Oxidative Stress as a Risk Factors in the Development of Colorectal Cancer

Diana Sawicka et al. Int J Mol Sci. .

Abstract

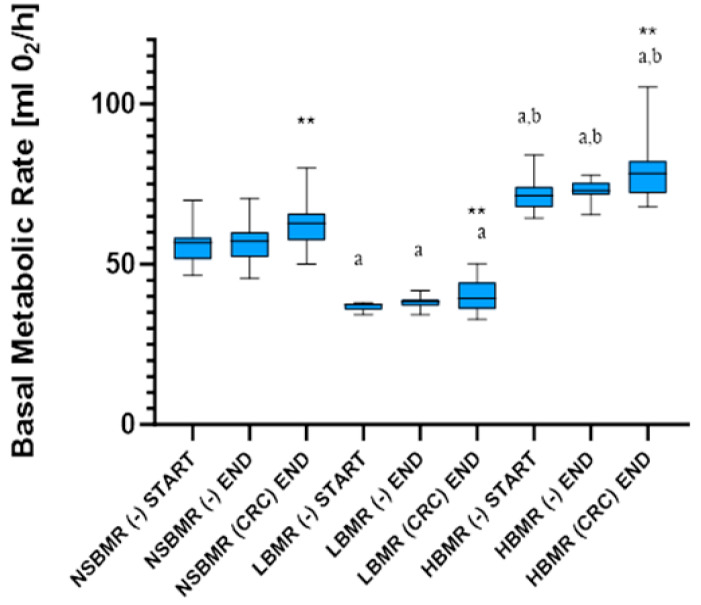
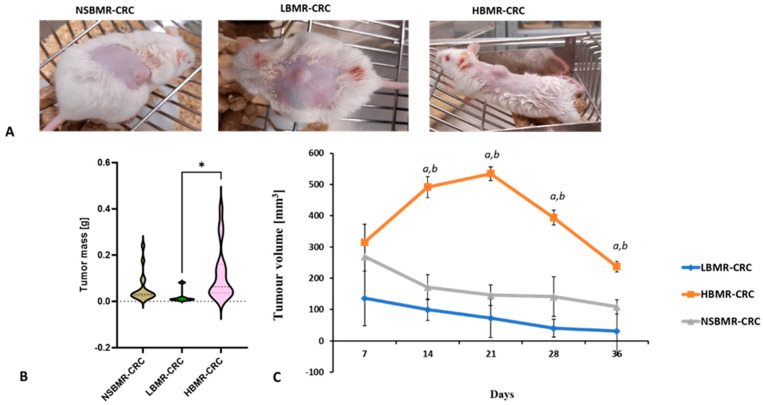
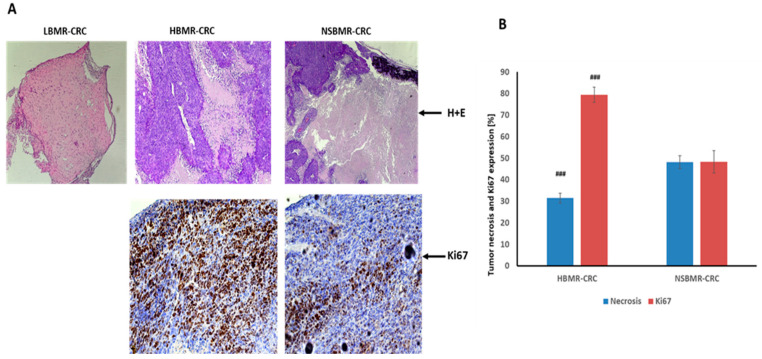
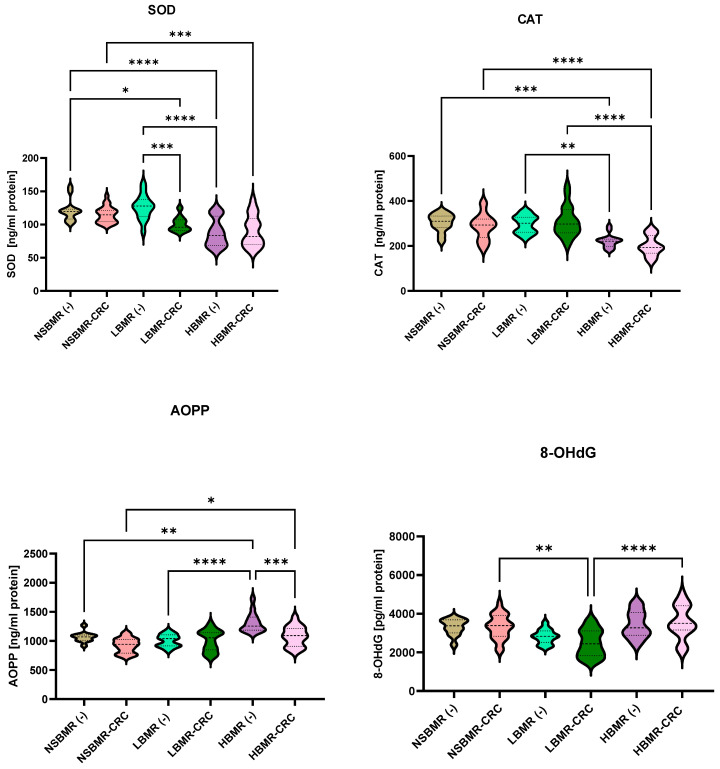
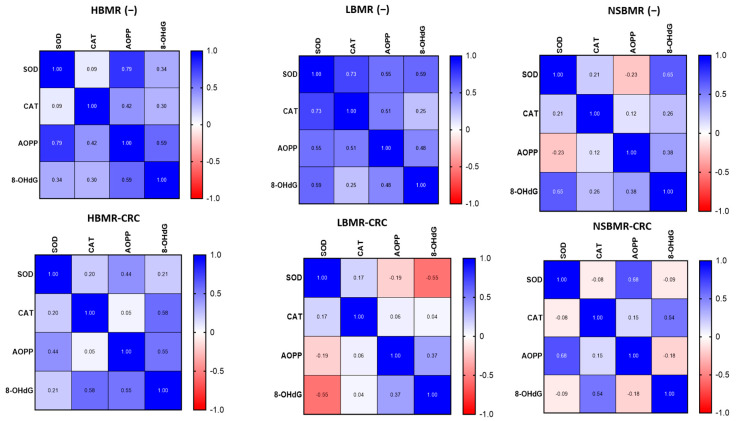
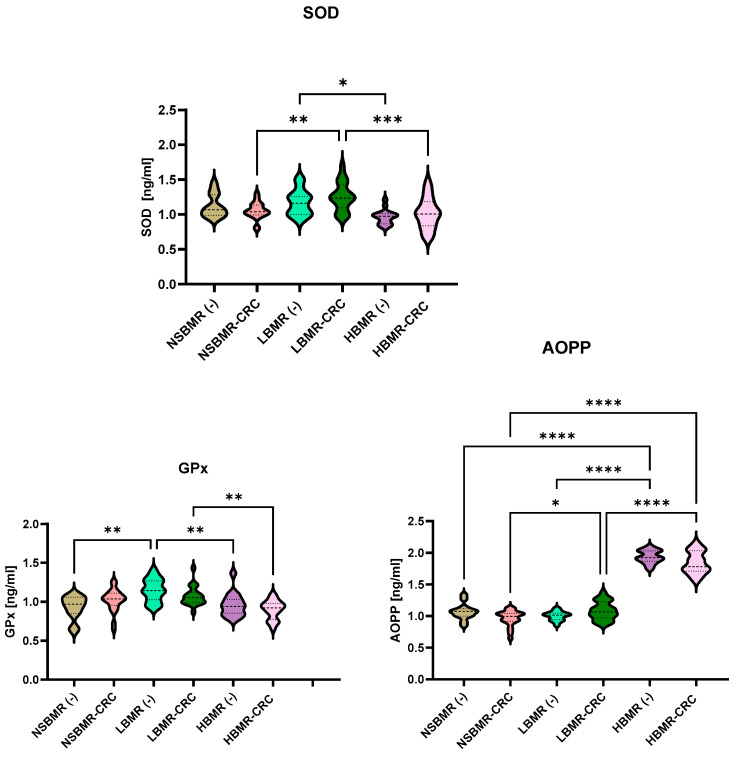
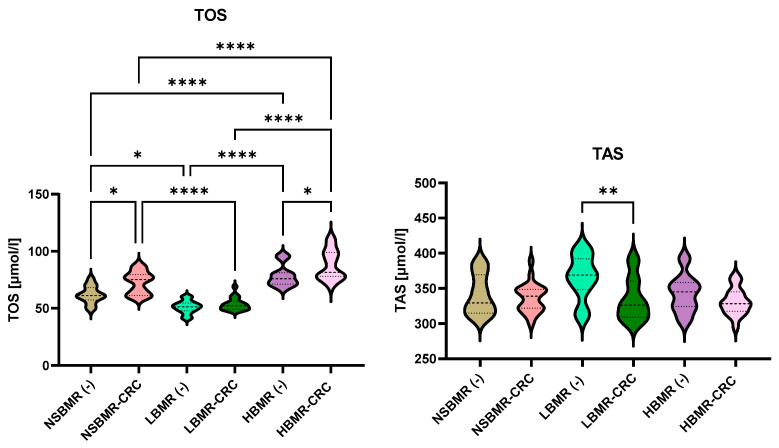
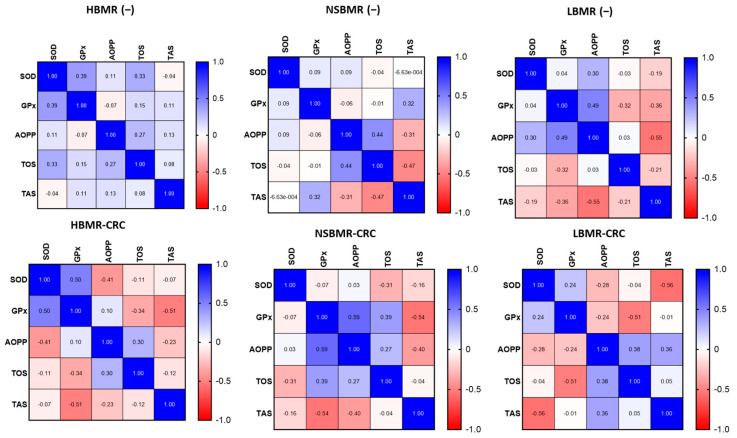
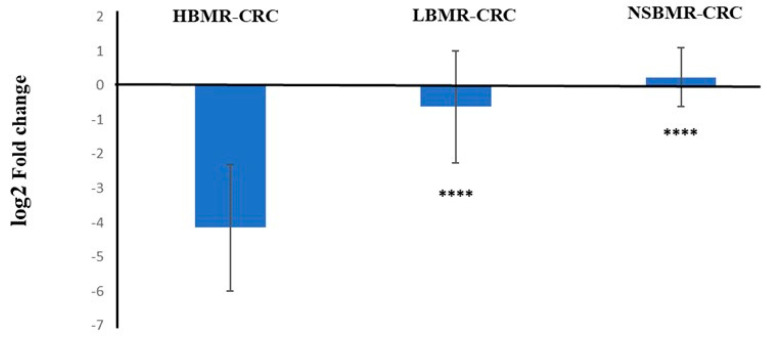
There is growing evidence that the body's energy expenditures constitute a significant risk factor for the development of most deadly diseases, including cancer. Our aim was to investigate the impact of basal metabolic rate (BMR) on the growth and progression of colorectal cancer (CRC). To do so, we used a unique model consisting of three lines of laboratory mice (Mus musculus) artificially selected for high (HBMR) and low (LBMR) basal metabolic rate and randomly bred individuals (non-selected, NSBMR). The experimental individuals were implanted with human colorectal cancer cells DLD-1. The variation in BMR between the lines allowed for testing the impact of whole-body metabolism on oxidative and antioxidant parameters in the liver throughout the cancerogenesis process. We investigated the dependence between metabolic values, reactive oxygen species (ROS) levels, and Kelch-like ECH-associated protein 1-based E3 ligase complexes (Keap1) gene activity in these animals. We found that the HBMR strain had a higher concentration of oxidative enzymes compared to the LBMR and NSBMR. Furthermore, the growth rate of CRC tumors was associated with alterations in the levels of oxidative stress enzymes and Keap1 expression in animals with a high metabolic rate. Our results indicate that a faster growth and development of CRC line DLD-1 is associated with enzymatic redox imbalance in animals with a high BMR.

Keywords: colorectal cancer; keap1; metabolic rate; oxidative stress.


Conflict of interest statement

The funders had no role in the design of the study; in the collection, analyses, or interpretation of data; in the writing of the manuscript; or in the decision to publish the results.

Figures

Figure 1
Figure 1
Basal metabolic rate values (start and end) in mice divergently selected for HBMR LBMR NSBMR in two experimental groups: without CRC (−) and with CRC. The results are expressed as the mean ± SEM for each group. ** p < 0.01 vs. animals without CRC (−) in each tested line, a p < 0.05 vs. NSBMR start/end (−) and (CRC) end, respectively, b p < 0.05 vs. LBMR start/end (−) and (CRC) end, respectively.
Figure 2
Figure 2
Image of tumor size (A), tumor mass at 36 days (B), and tumor growth (C) changes in studied groups. The results are expressed as the mean ± SEM for each group. * p < 0.05, a p < 0.01 vs. NSBMR-CRC, b p < 0.01 vs. LBMR-CRC.
Figure 3
Figure 3
H&E staining, Ki67 expression (200× magnification) (A) and percentage of tumor necrosis and Ki67 expression (B) in mice with CRC. (No tumor cells were found by H&E staining in the LBMR-CRC group; therefore, a proliferation assay using the Ki67 antibody was not performed). ### p < 0.001 vs. NSBMR-CRC.
Figure 4
Figure 4
SOD, CAT, AOP, and 8-OHdG concentrations in livers of the studied animal groups. The results are presented as violin plots for each group. Differences statistically important: * p < 0.05, ** p < 0.01, *** p < 0.001, **** p < 0.0001.
Figure 5
Figure 5
The Pearson correlations of antioxidant/oxidative enzyme levels in livers of the studied animal groups. The results are presented as heat maps with r values for each group.
Figure 6
Figure 6
SOD, GPx and AOPP concentrations in serum of the studied animal groups. The results are presented as violin plots for each group. Differences statistically significant: * p < 0.05, ** p < 0.01, *** p < 0.001, **** p < 0.0001.
Figure 7
Figure 7
TAS and TOS concentrations in serum of the studied animal groups. The results are presented as violin plots for each group. Differences statistically significant: * p < 0.05, ** p < 0.01, **** p < 0.0001.
Figure 8
Figure 8
The Pearson correlations of antioxidant/oxidative enzyme levels in serum of the studied animal groups. The results are presented as heat maps with r values for each group.
Figure 9
Figure 9
Keap1 expression in livers of studied animal groups with CRC. The results are presented as log2 delta-corrected Ct values. Differences statistically significant: **** p < 0.001 vs. HBMR-CRC group.

Similar articles

Cited by

References

    1. Stec R., Bodnar L., Szczylik C. Feasibility and Efficacy of Capecitabine and FOLFIRI in Patients Aged 65 Years and Older with Advanced Colorectal Cancer: A Retrospective Analysis. J. Cancer Res. Clin. Oncol. 2010;136:283–292. doi: 10.1007/s00432-009-0660-y. - DOI - PMC - PubMed
    1. Du Q., Zheng Z., Wang Y., Yang L., Zhou Z. Genetically Predicted Thyroid Function and Risk of Colorectal Cancer: A Bidirectional Mendelian Randomization Study. J. Cancer Res. Clin. Oncol. 2023;149:14015–14024. doi: 10.1007/s00432-023-05233-9. - DOI - PMC - PubMed
    1. Kliemann N., Huybrechts I., Murphy N., Gunter M. Basal Metabolic Rate and Risk of Colorectal Cancer in the European Prospective Investigation into Cancer and Nutrition. Rev. Épidémiologie Santé Publique. 2018;66:S252. doi: 10.1016/j.respe.2018.05.049. - DOI
    1. Sawicka D., Maciak S., Kozłowska H., Kasacka I., Kloza M., Sadowska A., Sokołowska E., Konarzewski M., Car H. Functional and Structural Changes in Aorta of Mice Divergently Selected for Basal Metabolic Rate. J. Comp. Physiol. B. 2020;190:101–112. doi: 10.1007/s00360-019-01252-6. - DOI - PubMed
    1. Maciak S., Sawicka D., Sadowska A., Prokopiuk S., Buczyńska S., Bartoszewicz M., Niklińska G., Konarzewski M., Car H. Low Basal Metabolic Rate as a Risk Factor for Development of Insulin Resistance and Type 2 Diabetes. BMJ Open Diab. Res. Care. 2020;8:e001381. doi: 10.1136/bmjdrc-2020-001381. - DOI - PMC - PubMed

Substances