. 2024 Oct 5;25(19):10734.
doi: 10.3390/ijms251910734.

Sodium Hydrosulfide Protects Rats from Hypobaric-Hypoxia-Induced Acute Lung Injury

Affiliations

Sodium Hydrosulfide Protects Rats from Hypobaric-Hypoxia-Induced Acute Lung Injury

Renjie Wang et al. Int J Mol Sci. .

Abstract

Hydrogen sulfide (H2S), as a key gas signaling molecule, plays an important role in regulating various diseases, with appropriate concentrations providing antioxidative, anti-inflammatory, and anti-apoptotic effects. The specific role of H2S in acute hypoxic injury remains to be clarified. This study focuses on the H2S donor sodium hydrosulfide (NaHS) and explores its protective effects and mechanisms against acute hypoxic lung injury. First, various mouse hypoxia models were established to evaluate H2S's protection in hypoxia tolerance. Next, a rat model of acute lung injury (ALI) induced by hypoxia at 6500 m above sea level for 72 h was created to assess H2S's protective effects and mechanisms. Evaluation metrics included blood gas analysis, blood routine indicators, lung water content, and lung tissue pathology. Additionally, LC-MS/MS and bioinformatic analyses were combined in performing quantitative proteomics on lung tissues from the normoxic control group, the hypoxia model group, and the hypoxia model group with NaHS treatment to preliminarily explore the protective mechanisms of H2S. Further, enzyme-linked immunosorbent assays (ELISA) were used to measure oxidative stress markers and inflammatory factors in rat lung tissues. Lastly, Western blot analysis was performed to detect Nrf2, HO-1, P-NF-κB, NF-κB, HIF-1α, Bcl-2, and Bax proteins in lung tissues. Results showed that H2S exhibited significant anti-hypoxic effects in various hypoxia models, effectively modulating blood gas and blood routine indicators in ALI rats, reducing pulmonary edema, improving lung tissue pathology, and alleviating oxidative stress, inflammatory responses, and apoptosis levels.

Keywords: acute lung injury; anti-apoptotic; anti-inflammatory; antioxidant; high-altitude hypoxia; hydrogen sulfide; proteomics.


Conflict of interest statement

The authors declare that they do not have any conflicts of interest related to the contents of this article.

Figures

Figure 1
Figure 1
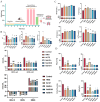
Effects of intraperitoneal NaHS injection on the survival time of hypoxic mice. Data are expressed as the mean ± SD (n = 8 per group). Note: # p < 0.05 and ## p < 0.01 compared with the Control group. Control: control group; ACTZ: positive-control group; NaHS-L: low-dose NaHS group; NaHS-M: medium-dose NaHS group; NaHS-H: high-dose NaHS group. (A) Schematic diagram of the hypoxia model test procedures in mice. (B) Normobaric hypoxia test. (C) Acute hypoxia test. (D) Sodium nitrite-induced hypoxia test.
Figure 2
Figure 2
Effects of intraperitoneal NaHS injection on blood gas parameters in high-altitude hypobaric hypoxia ALI rats. Data are expressed as the mean ± SD (n = 8 per group). Note: * p < 0.05 and ** p < 0.01 compared with the Control group; # p < 0.05 and ## p < 0.01 compared with the HMG group. (A) Schematic diagram of the acute hypoxia rat model experimental procedure. (B) Acid–base-related blood gas parameters. (C) Electrolyte-related blood gas parameters. (D) Oxygen-related blood gas parameters.
Figure 3
Figure 3
Effects of intraperitoneal NaHS injection on hematological parameters in hypoxia-induced ALI rats. Data are expressed as the mean ± SD (n = 8 per group). Note: * p < 0.05 and ** p < 0.01 compared with the Control group; # p < 0.05 and ## p < 0.01 compared with the HMG group. (A) White blood cell (WBC) concentration. (B) Red blood cell (RBC) concentration. (C) Hemoglobin (HGB) concentration. (D) Hematocrit (HCT) ratio. (E) Platelet (PLT) concentration. (F) Lymphocyte (LYMPH) concentration.
Figure 4
Figure 4
Effects of intraperitoneal NaHS injection on lung tissue structure in rats with ALI induced by high-altitude hypoxia (n = 3 per group). Note: ** p < 0.01 compared with the Control group; # p < 0.05 and ## p < 0.01 compared with the HMG group. Data in panel B are expressed as the mean ± SD (n = 6 per group). In panel (A), red arrows indicate thrombotic vessels, and green arrows indicate inflammatory cell aggregates. (A) Impact of NaHS on lung tissue structure in hypoxic rats. (B) Effect of NaHS on lung water content in hypoxic rats. (C) Lung injury score.
Figure 5
Figure 5
Quantitative proteomic analysis of lung tissue. (A) Principal component analysis (PCA) of protein data from the Control, HMG, and NaHS groups. (B) Volcano plot of differential proteins between the Control and HMG groups. (C) Volcano plot of differential proteins between the HMG and NaHS groups. (D) Cluster heatmap of differential proteins between the Control and HMG groups. (E) Cluster heatmap of differential proteins between the HMG and NaHS groups.
Figure 6
Figure 6
Bioinformatic analysis of quantitative proteomics in lung tissue. Note: Data in panels (E,F) are presented as the mean ± SD (n = 4 per group). * p < 0.05 compared with the Control group; # p < 0.05 and ## p < 0.01 compared with the HMG group. (A) Venn diagram of differential proteins between the HMG and NaHS groups and between the Control and HMG groups, along with GO enrichment analysis of the intersecting differential proteins. (B) KEGG pathway analysis of upregulated differential proteins in the Control vs. HMG comparison. (C) KEGG pathway analysis of downregulated differential proteins in the HMG vs. NaHS comparison. (D) HIF-1 pathway diagram. (E) Expression levels of Ripk1 in the quantitative proteomic data across groups. (F) Expression levels of MPO in the quantitative proteomic data across groups. (G) Expression levels of Gstt3 in the quantitative proteomic data across groups.
Figure 6
Figure 6
Bioinformatic analysis of quantitative proteomics in lung tissue. Note: Data in panels (E,F) are presented as the mean ± SD (n = 4 per group). * p < 0.05 compared with the Control group; # p < 0.05 and ## p < 0.01 compared with the HMG group. (A) Venn diagram of differential proteins between the HMG and NaHS groups and between the Control and HMG groups, along with GO enrichment analysis of the intersecting differential proteins. (B) KEGG pathway analysis of upregulated differential proteins in the Control vs. HMG comparison. (C) KEGG pathway analysis of downregulated differential proteins in the HMG vs. NaHS comparison. (D) HIF-1 pathway diagram. (E) Expression levels of Ripk1 in the quantitative proteomic data across groups. (F) Expression levels of MPO in the quantitative proteomic data across groups. (G) Expression levels of Gstt3 in the quantitative proteomic data across groups.
Figure 7
Figure 7
Effects of intraperitoneal NaHS injection on oxidative stress and inflammatory markers in hypoxia-induced ALI rats. Data are expressed as the mean ± SD (n = 6 per group). Note: ** p < 0.01 compared with the Control group; # p < 0.05 and ## p < 0.01 compared with the HMG group. (A) MDA levels. (B) SOD activity. (C) CAT activity. (D) GSH levels. (E) IL-1β levels. (F) IL-6 levels. (G) IL-10 levels. (H) TNF-α levels.
Figure 8
Figure 8
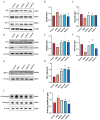
Effect of intraperitoneal NaHS injection on the Nrf2/NF-κB/HIF-1/Bcl-2 signaling pathways in the lung tissue of hypoxic rats. Data are presented as mean ± SD (n = 3/group). Notes: * p < 0.05 compared with the Control group; # p < 0.05 and ## p < 0.01 compared with the HMG group. (A) Western blot bands for Bax, Bcl-2, and β-actin. (B,C) Western blot data for Bcl-2 and Bax were quantified using density analysis. (D) Western blot bands for Nrf2, HO-1, and β-actin. (E,F) Western blot data for Nrf2 and HO-1 were quantified using density analysis. (G) Western blot bands for HIF-1α and β-actin. (H) Western blot data for HIF-1α were quantified using density analysis. (I) Western blot bands for P-Nf-κB p65, Nf-κB p65, and β-actin. (J) Western blot data for P-Nf-κB p65/Nf-κB p65 were quantified using density analysis.
Figure 9
Figure 9
Mechanism of action of NaHS in high-altitude hypobaric hypoxia ALI.

Similar articles

Cited by

References

    1. Persson P.B., Bondke Persson A. Altitude sickness and altitude adaptation. Acta Physiol. 2017;220:303–306. doi: 10.1111/apha.12894. - DOI - PubMed
    1. Gatterer H., Villafuerte F.C., Ulrich S., Bhandari S.S., Keyes L.E., Burtscher M. Altitude illnesses. Nat. Rev. Dis. Primers. 2024;10:43. doi: 10.1038/s41572-024-00526-w. - DOI - PubMed
    1. Nieman G.F., Andrews P., Satalin J., Wilcox K., Kollisch-Singule M., Madden M., Aiash H., Blair S.J., Gatto L.A., Habashi N.M. Acute lung injury: How to stabilize a broken lung. Crit. Care. 2018;22:136. doi: 10.1186/s13054-018-2051-8. - DOI - PMC - PubMed
    1. Naeije R. High altitude travelling with pulmonary arterial hypertension. Eur. Respir. J. 2024;63:2400111. doi: 10.1183/13993003.00111-2024. - DOI - PubMed
    1. Matthay M.A., Zemans R.L., Zimmerman G.A., Arabi Y.M., Beitler J.R., Mercat A., Herridge M., Randolph A.G., Calfee C.S. Acute respiratory distress syndrome. Nat. Rev. Dis. Primers. 2019;5:18. doi: 10.1038/s41572-019-0069-0. - DOI - PMC - PubMed

MeSH terms

Grants and funding

LinkOut - more resources