Meta-Analysis
. 2024 Oct 5;25(19):10743.
doi: 10.3390/ijms251910743.

Diagnostic Utility of Copeptin in Pediatric Patients with Polyuria-Polydipsia Syndrome: A Systematic Review and Meta-Analysis

Affiliations
Meta-Analysis

Diagnostic Utility of Copeptin in Pediatric Patients with Polyuria-Polydipsia Syndrome: A Systematic Review and Meta-Analysis

Diana-Andreea Ciortea et al. Int J Mol Sci. .

Abstract

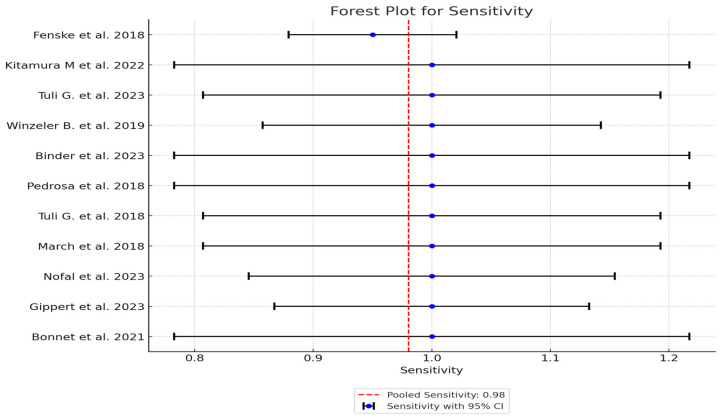
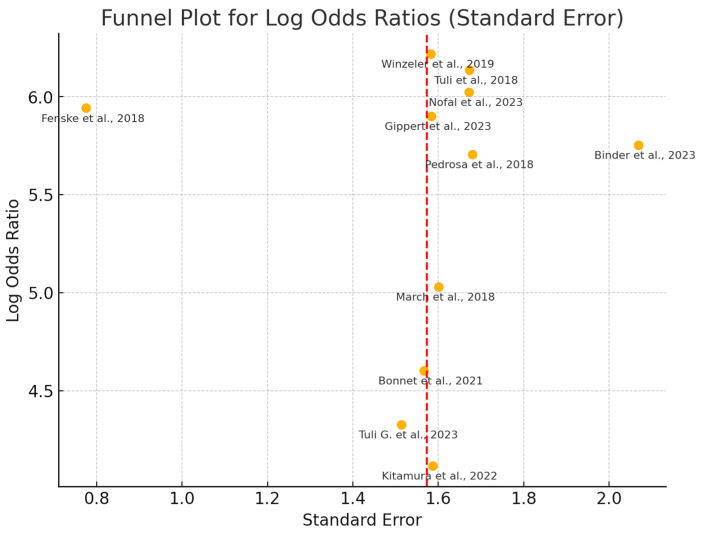
Pediatric patients with polyuria polydipsia syndrome (PPS) represent a diagnostic challenge for clinicians because of the technical difficulties in performing the gold standard water deprivation test (WDT). Copeptin, a stable biomarker representing the C-terminal portion of the polypeptide chain of the antidiuretic hormone, is a reliable diagnostic tool. To assess the diagnostic accuracy of baseline copeptin dosing, arginine/hypertonic saline copeptin stimulation tests, and WDT. This study aimed to establish the diagnostic utility of copeptin in pediatric patients by distinguishing between central diabetes insipidus, nephrogenic diabetes insipidus, and primary polydipsia. Comparative and non-comparative primary studies published between January 2018 and August 2024 focusing on children were searched and included in PubMed, Cochrane Library, Web of Science, ScienceDirect, Scopus, and Google Scholar. The QUADAS-2 tool was used to assess the risk of bias and applicability. Meta-analyses used fixed effects models because of low heterogeneity and the HSROC model. Eleven studies were included with an overall low bias and no significant applicability concerns. The mean pooled sensitivity = 0.98 (95% CI: 0.936-1.025), pooled specificity = 0.947 (95% CI: 0.920-0.973), and AUC = 0.972 (95% CI: 0.952-0.992), indicating excellent diagnostic accuracy. Stimulation methods for copeptin dosing represent an effective and less invasive diagnostic test for children with PPS, and future development of standard copeptin testing protocols is needed.

Keywords: copeptin; diagnostic accuracy; pediatrics; polyuria-polydipsia syndrome.


Conflict of interest statement

The authors declare no conflicts of interest.

Figures

Scheme 1
Scheme 1
PRISMA-DTA flow diagram.
Figure 1
Figure 1
QUADAS-2 assessment—Study 1 [10], Study 2 [16], Study 3 [17], Study 4 [18], Study 5 [19], Study 6 [20], Study 7 [21], Study 8 [22], Study 9 [23], Study 10 [24], Study 11 [25].
Figure 2
Figure 2
Forest plot of Sensitivity—illustrating the sensitivity of copeptin across 11 studies. The pooled sensitivity is 0.96, indicating high diagnostic accuracy in identifying true positive cases. (Fenske et al., 2018 [10], Kitamura et al., 2022 [16], Tuli et al., 2023 [17], and Winzeler et al., 2019 [18], Binder et al., 2023 [19], Pedrosa et al., 2018 [20], Tuli et al., 2018 [21], March et al., 2018 [22], Nofal et al., 2023 [23], Gippert et al., 2023 [24], Bonnet et al. [25]).
Figure 3
Figure 3
Forest plot of Specificity—showing the specificity of copeptin across 11 studies. The pooled specificity is 0.95, demonstrating strong diagnostic capability in correctly identifying true negative cases (Fenske et al., 2018 [10], Kitamura et al., 2022 [16], Tuli et al., 2023 [17], and Winzeler et al., 2019 [18], Binder et al., 2023 [19], Pedrosa et al., 2018 [20], Tuli et al., 2018 [21], March et al., 2018 [22], Nofal et al., 2023 [23], Gippert et al., 2023 [24], Bonnet et al. [25]).
Figure 4
Figure 4
ROC plot for the selected studies (Fenske et al., 2018 [10], Kitamura et al., 2022 [16], Tuli et al., 2023 [17], and Winzeler et al., 2019 [18], Binder et al., 2023 [19], Pedrosa et al., 2018 [20], Tuli et al., 2018 [21], March et al., 2018 [22], Nofal et al., 2023 [23], Gippert et al., 2023 [24], Bonnet et al. [25]).
Figure 5
Figure 5
Forest plot of pooled sensitivity for all 11 studies. The red dashed line represents the overall pooled sensitivity estimate of 0.98 (95% CI: 0.936–1.025). The individual study estimate sensitivity values (blue dots) are shown with 95% confidence intervals represented as lines, highlighting the consistency of high sensitivity across most studies. (Fenske et al., 2018 [10], Kitamura et al., 2022 [16], Tuli et al., 2023 [17], and Winzeler et al., 2019 [18], Binder et al., 2023 [19], Pedrosa et al., 2018 [20], Tuli et al., 2018 [21], March et al., 2018 [22], Nofal et al., 2023 [23], Gippert et al., 2023 [24], Bonnet et al. [25]).
Figure 6
Figure 6
Forest plot of pooled specificity for 11 studies. The red dashed line represents the overall pooled specificity estimate of 0.95 (95% CI: 0.920–0.973). Each study’s specificity represented by a green dot is shown with its respective 95% confidence interval (represented by lines), demonstrating variability in test performance across studies, with most estimates clustering near the pooled estimate. (Fenske et al., 2018 [10], Kitamura et al., 2022 [16], Tuli et al., 2023 [17], and Winzeler et al., 2019 [18], Binder et al., 2023 [19], Pedrosa et al., 2018 [20], Tuli et al., 2018 [21], March et al., 2018 [22], Nofal et al., 2023 [23], Gippert et al., 2023 [24], Bonnet et al. [25]).
Figure 7
Figure 7
Forest plot of AUC (Area Under the Curve) across the 11 studies. The red dashed line represents the overall pooled AUC estimate of 0.97 (95% CI: 0.95–0.99), highlighting the high diagnostic accuracy of copeptin across studies. The tight clustering of AUC values (purple dots, associated with lines representing CI) around the pooled estimate further emphasizes the reliability and consistency of copeptin as a diagnostic tool for polyuria-polydipsia syndrome in pediatric patients. (Fenske et al., 2018 [10], Kitamura et al., 2022 [16], Tuli et al., 2023 [17], and Winzeler et al., 2019 [18], Binder et al., 2023 [19], Pedrosa et al., 2018 [20], Tuli et al., 2018 [21], March et al., 2018 [22], Nofal et al., 2023 [23], Gippert et al., 2023 [24], Bonnet et al. [25]).
Figure 8
Figure 8
SROC plot from HSROC model—shows diagnostic performance of copeptin across all 11 studies. Circles represent summary estimate of sensitivity and specificity across studies. Lines around circle represent confidence regions for these estimates, showing uncertainty around summary points. x-axis (false positive rate) and y-axis (Sensitivity) are used to plot the trade-off between sensitivity and specificity.
Figure 9
Figure 9
Funnel plot publication bias—it presents the Log Odds Ratios (LOR) of the included studies along with their respective confidence intervals (CIs) plotted against the standard errors (SEs). The vertical red line represents the mean LOR, while the horizontal spread of points indicates the variability in effect sizes. (Fenske et al., 2018 [10], Kitamura et al., 2022 [16], Tuli et al., 2023 [17], and Winzeler et al., 2019 [18], Binder et al., 2023 [19], Pedrosa et al., 2018 [20], Tuli et al., 2018 [21], March et al., 2018 [22], Nofal et al., 2023 [23], Gippert et al., 2023 [24], Bonnet et al. [25]).
Figure 10
Figure 10
Diagnostic accuracy metrics by method—The boxplots illustrate the distribution of Sensitivity, Specificity, Positive Predictive Value (PPV), Negative Predictive Value (NPV), Positive Likelihood Ratio (LR+), Negative Likelihood Ratio (LR−), and Area Under the Curve (AUC) across the different diagnostic methods assessed in the included studies.

Similar articles

Cited by

References

    1. Gubbi S., Fady H.-S., Koch C.A., Verbalis J.G. Endotext. National Library of Medicine; Bethesda, MD, USA: 2022. [(accessed on 28 March 2024)]. Diagnostic Testing for Diabetes Insipidus. Available online: https://www.ncbi.nlm.nih.gov/books/NBK537591/
    1. Yoshimura M., Conway-Campbell B., Ueta Y. Arginine Vasopressin: Direct and Indirect Action on Metabolism. Peptides. 2021;142:170555. doi: 10.1016/j.peptides.2021.170555. - DOI - PMC - PubMed
    1. Fenske W., Quinkler M., Lorenz D., Zopf K., Haagen U., Papassotiriou J., Pfeiffer A.F.H., Fassnacht M., Störk S., Allolio B. Copeptin in the Differential Diagnosis of the Polydipsia-Polyuria Syndrome—Revisiting the Direct and Indirect Water Deprivation Tests. J. Clin. Endocrinol. Metab. 2011;96:1506–1515. doi: 10.1210/jc.2010-2345. - DOI - PubMed
    1. Christ-Crain M., Fenske W. Copeptin in the diagnosis of vasopressin-dependent disorders of fluid homeostasis. Nat. Rev. Endocrinol. 2016;12:168–176. doi: 10.1038/nrendo.2015.224. - DOI - PubMed
    1. Driano J.E., Lteif A.N., Creo A.L. Vasopressin-Dependent Disorders: What Is New in Children? Pediatrics. 2021;147:e2020022848. doi: 10.1542/peds.2020-022848. - DOI - PubMed

LinkOut - more resources