. 2024 Oct 9;25(19):10822.
doi: 10.3390/ijms251910822.

Proof of Concept for Genome Profiling of the Neurofibroma/Sarcoma Sequence in Neurofibromatosis Type 1

Affiliations

Proof of Concept for Genome Profiling of the Neurofibroma/Sarcoma Sequence in Neurofibromatosis Type 1

Ilenia Rita Cannizzaro et al. Int J Mol Sci. .

Abstract

Neurofibromatosis type 1 (NF1) is an autosomal dominant genetic disorder characterized by the predisposition to develop tumors such as malignant peripheral nerve sheath tumors (MPNSTs) which represents the primary cause of death for NF1-affected patients. Regardless of the high incidence and mortality, the molecular mechanisms underneath MPNST growth and metastatic progression remain poorly understood. In this proof-of-concept study, we performed somatic whole-exome sequencing (WES) to profile the genomic alterations in four samples from a patient with NF1-associated MPNST, consisting of a benign plexiform neurofibroma, a primary MPNST, and metastases from lung and skin tissues. By comparing genomic patterns, we identified a high level of variability across samples with distinctive genetic changes which allow for the definition of profiles of the early phase with respect to the late metastatic stages. Pathogenic and likely pathogenic variants were abundant in the primary tumor, whereas the metastatic samples exhibited a high level of copy-number variations (CNVs), highlighting a possible genomic instability in the late phases. The most known MPNST-related genes, such as TP53 and SUZ12, were identified in CNVs observed within the primary tumor. Pathway analysis of altered early genes in MPNST pointed to a potential role in cell motility, division and metabolism. Moreover, we employed survival analysis with the TCGA sarcoma genomic dataset on 262 affected patients, in order to corroborate the predictive significance of the identified early and metastatic MPNST driver genes. Specifically, the expression changes related to the mutated genes, such as in RBMX, PNPLA6 and AGAP2, were associated with reduced patient survival, distinguishing them as potential prognostic biomarkers. This study underlines the relevance of integrating genomic results with clinical information for early diagnosis and prognostic understanding of tumor aggressiveness.

Keywords: MPNST; genomic signature; malignant peripheral nerve sheath tumor; neurofibromatosis type 1; tumor progression; whole exome sequencing (WES).


Conflict of interest statement

The authors declare that they have no conflicts of interest.

Figures
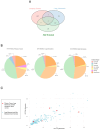
Figure 1
Figure 1
Genomic Variant Signature. (A) The Venn plot shows common and unique variants among primary tumor, lung metastasis, and skin metastasis, marking overlaps. (B) The pie charts illustrate the total number of variants identified in the different samples, according to the coding impact. (C) The VAF plot shows the distribution of variant allele frequencies (VAFs) in primary tumor, lung metastasis and skin metastasis (red), and lung metastasis and skin metastasis (blue).
Figure 2
Figure 2
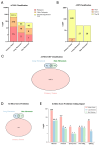
(A,B) The bar plots illustrate the number (log10-scaled) of candidate variants selected through the ACMG and AMP classification for the primary tumor, lung metastasis and skin metastasis. The selected variants are classified as pathogenic (red), likely pathogenic (orange) and uncertain significance (VUS in yellow) for ACMG, and Tier I (red), Tier II (orange) and Tier III (yellow) for AMP. The number within each bar represents the absolute number of the identified variants. (C) The Venn plot shows the distribution and intersection of unique and common variants between the primary tumor, lung metastasis, and skin metastasis, filtered for pathogenicity criteria ACMG/AMP. (D) In silico score prediction Venn plot of variants shared among the three samples and (E) bar plot of the total number (log10-scaled) of variants retained, with prediction score in the different samples according to the impact on the protein coding sequence. The number on the top of each bar represents the absolute count of variants.
Figure 3
Figure 3
UpSetR graph. Visualization of intersections of the ACMG/AMP-based genes in primary tumor, lung metastasis, and skin metastasis samples with genes from the GDC-Data Portal, CBio-portal, and literature datasets [19,20,21,25,26,27,28,29]. It is important to note that UpsetR performs the intersection of all lists simultaneously. Therefore, the numbers obtained from pairwise comparisons may be lower, since genes common to more than two lists are not counted multiple times. This approach allows you to identify unique intersections between multiple datasets, providing a more complete view of the overlaps between different groups of genes, e.g., intersections between primary tumor and GDC are the sum of 49 (primary + GDC), 14 (primary + GDC + Lit), 4 (primary + GDC + Lit + CBio) and 1 (primary + metastasis + GDC), for a total of 68, as reported in the text. The list of literature genes is available in Supplementary Table S2.
Figure 4
Figure 4
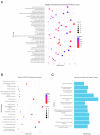
GO, KEGG and Reactome enrichment analysis of Primary Tumor sample. (A,B) Enriched GO-term dot plots. The size of the dots represents the number of genes in the significant gene list associated with the GO or KEGG terms. The color of the dots represents the adjusted p-values (Benjamini–Hochberg, BH). (C) Bar plots displaying the Reactome terms ordered by adjusted p-values (BH).
Figure 5
Figure 5
Kaplan–Meier Analysis. (A) Kaplan–Meier survival curves of patients affected with sarcoma (TGCA-SARC, n = 262) scored for different gene expression levels (LOW expression in blue and HIGH expression in red from the SARCOMA dataset) of the candidate genes identified in the primary tumor. (B) Kaplan–Meier survival curves obtained from transcriptomic data in sarcoma (TGCA-SARC, n = 262), lung cancer (TGCA-LUAD, n = 483) (TGCA-LUSC, n = 486) and skin cancer (TGCA-SKCM, n = 461) datasets, based on the expression of genes which are shared between the two metastatic samples.
Figure 6
Figure 6
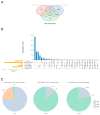
(A) Venn plot shows the distribution and intersection of unique and common genes identified in CNVs among the primary tumor, lung metastasis, and skin metastasis. (B) UpSetR graph display the intersections of CNV-associated genes in the primary tumor, lung metastasis, and skin metastasis samples with the genes from the GDC-Data Portal, CBio-portal, and literature datasets [19,20,21,25,26,27,28,29]. (C) Pie charts illustrate the percentage of variants identified in the different samples, according to the molecular type.
Figure 7
Figure 7
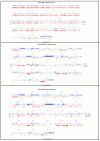
CNV profiling from primary tumor (top), lung metastasis (middle) and skin metastasis (bottom) performed with CNVkit. The variations in Log2 Ratio (on the y axis) indicate alterations in the number of genomic copies on a logarithmic scale, and are calculated as the log2-scaled ratio between the number of observed and expected copies in a sample. Log2 values greater than 1 (log2 > 1) represent amplifications of more than two copies; log2 values lower than −1 (log2 < −1) represent deletions of at least one copy.

References

    1. Somatilaka B.N., Sadek A., McKay R.M., Le L.Q. Malignant Peripheral Nerve Sheath Tumor: Models, Biology, and Translation. Oncogene. 2022;41:2405–2421. doi: 10.1038/s41388-022-02290-1. - DOI - PMC - PubMed
    1. Gutmann D.H., Ferner R.E., Listernick R.H., Korf B.R., Wolters P.L., Johnson K.J. Neurofibromatosis Type 1. Nat. Rev. Dis. Primers. 2017;3:17004. doi: 10.1038/nrdp.2017.4. - DOI - PubMed
    1. Evans D.G., Howard E., Giblin C., Clancy T., Spencer H., Huson S.M., Lalloo F. Birth Incidence and Prevalence of Tumor-prone Syndromes: Estimates from a UK Family Genetic Register Service. Am. J. Med. Genet. A. 2010;152:327–332. doi: 10.1002/ajmg.a.33139. - DOI - PubMed
    1. De Raedt T., Brems H., Wolkenstein P., Vidaud D., Pilotti S., Perrone F., Mautner V., Frahm S., Sciot R., Legius E. Elevated Risk for MPNST in NF1 Microdeletion Patients. Am. J. Hum. Genet. 2003;72:1288–1292. doi: 10.1086/374821. - DOI - PMC - PubMed
    1. Spyk S., Thomas N., Cooper D.N., Upadhyaya M. Neurofibromatosis Type 1-Associated Tumours: Their Somatic Mutational Spectrum and Pathogenesis. Hum. Genom. 2011;5:623. doi: 10.1186/1479-7364-5-6-623. - DOI - PMC - PubMed

LinkOut - more resources