Comparative Study
. 2024 Oct 9;25(19):10848.
doi: 10.3390/ijms251910848.

Signature Proteins in Small Extracellular Vesicles of Granulocytes and CD4+ T-Cell Subpopulations Identified by Comparative Proteomic Analysis

Affiliations
Comparative Study

Signature Proteins in Small Extracellular Vesicles of Granulocytes and CD4+ T-Cell Subpopulations Identified by Comparative Proteomic Analysis

Sara Vázquez-Mera et al. Int J Mol Sci. .

Abstract

Several studies have described the proteomic profile of different immune cell types, but only a few have also analysed the content of their delivered small extracellular vesicles (sEVs). The aim of the present study was to compare the protein signature of sEVs delivered from granulocytes (i.e., neutrophils and eosinophils) and CD4+ T cells (i.e., TH1, TH2, and TH17) to identify potential biomarkers of the inflammatory profile in chronic inflammatory diseases. Qualitative (DDA) and quantitative (DIA-SWATH) analyses of in vitro-produced sEVs revealed proteome variations depending on the cell source. The main differences were found between granulocyte- and TH cell-derived sEVs, with a higher abundance of antimicrobial proteins (e.g., LCN2, LTF, MPO) in granulocyte-derived sEVs and an enrichment of ribosomal proteins (RPL and RPS proteins) in TH-derived sEVs. Additionally, we found differentially abundant proteins between neutrophil and eosinophil sEVs (e.g., ILF2, LTF, LCN2) and between sEVs from different TH subsets (e.g., ISG15, ITGA4, ITGB2, or NAMPT). A "proof-of-concept" assay was also performed, with TH2 biomarkers ITGA4 and ITGB2 displaying a differential abundance in sEVs from T2high and T2low asthma patients. Thus, our findings highlight the potential use of these sEVs as a source of biomarkers for diseases where the different immune cell subsets studied participate, particularly chronic inflammatory pathologies such as asthma or chronic obstructive pulmonary disease (COPD).

Keywords: exosomes; immune cells; inflammatory diseases; proteomics; small extracellular vesicles.


Conflict of interest statement

The authors declare no conflicts of interest.

Figures

Figure 1
Figure 1
Characterisation of the studied leukocyte subpopulations. (AD) Characterisation of eosinophils isolated from peripheral blood using flow cytometry (AC) and cytospin with Kwik-Diff staining (D). (EH) Characterisation of neutrophils isolated from peripheral blood using flow cytometry (EG) and cytospin with Kwik-Diff staining (H). (IL) Characterisation of T-helper (TH; CD4+) cells isolated from peripheral blood using flow cytometry (IK) and cytospin with Kwik-Diff staining (L). A representative picture for each cell subpopulation is depicted. (MO) Levels of prototypical TH1 (IFN-γ; (M)), TH2 (IL-4, IL-5, and IL-13; (N)), and TH17 (IL-17A; (O)) cytokines produced by TH cells upon PMA + ionomycin activation measured by multiplex ELISA (N = 3).
Figure 2
Figure 2
Characterisation of small extracellular vesicles (sEVs). (A,B) Representative images from transmission electron microscopy (TEM). The scale bars of images are 200 nm (A) and 100 nm (B). The acquisition was at an accelerating voltage of 40–100 kV. (C) Dynamic light scattering (DLS) measurement of the size of nanovesicles indicating peaks from 90 to 150 nm (i.e., sEV/exosome size). Three representative measurements are depicted.
Figure 3
Figure 3
Qualitative proteomic analyses of sEVs from different leukocyte subpopulations. (A) Venn diagrams of identified proteins in CD4+ T lymphocytes (TH cells) vs. granulocytes, eosinophils vs. neutrophils, and TH1 vs. TH2 vs. TH17. X-axes represent fold-change enrichment of the biological process (BP) over the whole human proteome. The ten most enriched BP in lymphocytes (CD4+ T cells) (B) and granulocytes (C) are depicted. The six processes with bigger changes between neutrophils and eosinophils (D) or between the different TH subpopulations (E) are shown.
Figure 4
Figure 4
Quantitative proteomic analysis of sEV proteins from granulocytes compared to CD4+ T cells. (A) Principal component analysis (PCA) of sEV protein expression in the study subpopulations. Square root range transformed data for quantitative comparison of all samples (N = 3 for each cell subpopulation). Principal component 1 (PC1) and PC2 allow for separation of granulocytes vs. lymphocytes. PC2 vs. PC3 allows for separation of the other cell subpopulations. (B) Volcano plot showing differentially expressed proteins in sEVs from granulocytes vs. CD4+ T cells. (C) GO term enrichment (biological processes; BP) dot plot with the most up- and downregulated proteins in granulocytes vs. CD4+ T cells. (D) Bar graphs for the sEV relative abundance (normalised to granulocytes) of LTF, LCN2, and RPL13 in granulocytes (Gr) and CD4+ T cells (TH) measured by LC-MS/MS. (E) Representative western blot showing LTF, LCN2, and RPL13 protein abundance in Gr- vs. TH-derived sEVs (10 µg). (F,G) Category netplot of the 6 most upregulated pathways (GSEA) in granulocytes (F) and CD4+ T cells (G). * p < 0.05; ** p < 0.01; **** p < 0.0001.
Figure 5
Figure 5
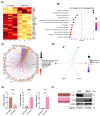
Quantitative proteomic analysis of sEV proteins from eosinophils compared to neutrophils. (A) Heatmap for the 25 more differentially expressed proteins with fold-change FC > 1 between eosinophil- and neutrophil-delivered sEVs. (B) GO term enrichment (biological processes; BP) dot plot with the most up- and downregulated proteins in sEVs from eosinophils vs. neutrophils. (C,D) Category netplot of the 6 most upregulated pathways (GSEA) in eosinophil- (C) and neutrophil-derived exosomes (D). (E) Bar graphs for the sEV relative abundance (normalised to eosinophils) of ILF2, LCN2, and LTF in eosinophils vs. neutrophils measured by LC-MS/MS. (F) Representative western blot showing ILF2, LCN2, and LTF protein abundance in sEVs from eosinophils (Eos) vs. neutrophils (Neut) (2 µg). * p < 0.05; ** p < 0.01.
Figure 6
Figure 6
Quantitative proteomic analysis of sEV proteins from different CD4+ T-cell subpopulations. (A) Heatmap of differentially expressed proteins between TH1, TH2, and TH17 cells. (B) Bar graphs for the sEV relative abundance (normalized to TH1) of ISG15, ITGA4, ITGB2, and NAMPT in CD4+ T-cell subpopulations measured by LC-MS/MS. (C) Representative western blot showing ISG15, ITGA4, ITGB2, and NAMPT protein abundance in TH1, TH2, and TH17-delivered sEVs (10 µg). (D) GO term enrichment (biological processes) dot plot with the most up- and downregulated proteins in TH1 sEVs compared to the other CD4+ T cells. (E) Category netplot of the 6 most up-regulated pathways in TH1 cell-derived sEVs. (F) GO term enrichment (biological processes) dot plot with the most up- and downregulated proteins in TH2 sEVs compared to the other CD4+ T cells. (G) Category netplot of the 6 most upregulated pathways in TH2 cell-derived sEVs. * p < 0.05; ** p < 0.01.
Figure 7
Figure 7
TH2 biomarkers ITGB2 and ITGB4 are enhanced in sEVs purified from serum samples from T2high compared to T2low asthma patients. sEVs were isolated from serum samples from T2high and T2low asthma donors with (A,B) ultracentrifugation (1 pool/condition) or (C,D) “Total Exosome Isolation Reagent (from serum)” (InvitrogenTM) (2 pools/condition). Western blot analysis of ITGA4, ITGB2, and GADPH (A,C) and normalised levels of ITGA4 and ITGB2 relative to the GAPDH abundance (B,D). In (D) a t-test was performed.

References

    1. Buzas E.I. The Roles of Extracellular Vesicles in the Immune System. Nat. Rev. Immunol. 2023;23:236–250. doi: 10.1038/s41577-022-00763-8. - DOI - PMC - PubMed
    1. Hazrati A., Soudi S., Malekpour K., Mahmoudi M., Rahimi A., Hashemi S.M., Varma R.S. Immune Cells-Derived Exosomes Function as a Double-Edged Sword: Role in Disease Progression and Their Therapeutic Applications. Biomark. Res. 2022;10:30. doi: 10.1186/s40364-022-00374-4. - DOI - PMC - PubMed
    1. Nguyen D.D., Lai J.-Y. Synthesis, Bioactive Properties, and Biomedical Applications of Intrinsically Therapeutic Nanoparticles for Disease Treatment. Chem. Eng. J. 2022;435:134970. doi: 10.1016/j.cej.2022.134970. - DOI
    1. Wang N., Wang Q., Du T., Gabriel A.N.A., Wang X., Sun L., Li X., Xu K., Jiang X., Zhang Y. The Potential Roles of Exosomes in Chronic Obstructive Pulmonary Disease. Front. Med. 2020;7:618506. doi: 10.3389/fmed.2020.618506. - DOI - PMC - PubMed
    1. Vázquez-Mera S., Martelo-Vidal L., Miguéns-Suárez P., Saavedra-Nieves P., Arias P., González-Fernández C., Mosteiro-Añón M., Corbacho-Abelaira M.D., Blanco-Aparicio M., Méndez-Brea P., et al. Serum Exosome Inflamma-miRs Are Surrogate Biomarkers for Asthma Phenotype and Severity. Allergy. 2023;78:141–155. doi: 10.1111/all.15480. - DOI - PubMed

Publication types

LinkOut - more resources