. 2024 Sep 26;24(19):6239.
doi: 10.3390/s24196239.

Spiral Annealing of Magnetic Microwires

Affiliations

Spiral Annealing of Magnetic Microwires

Alexander Chizhik et al. Sensors (Basel). .

Abstract

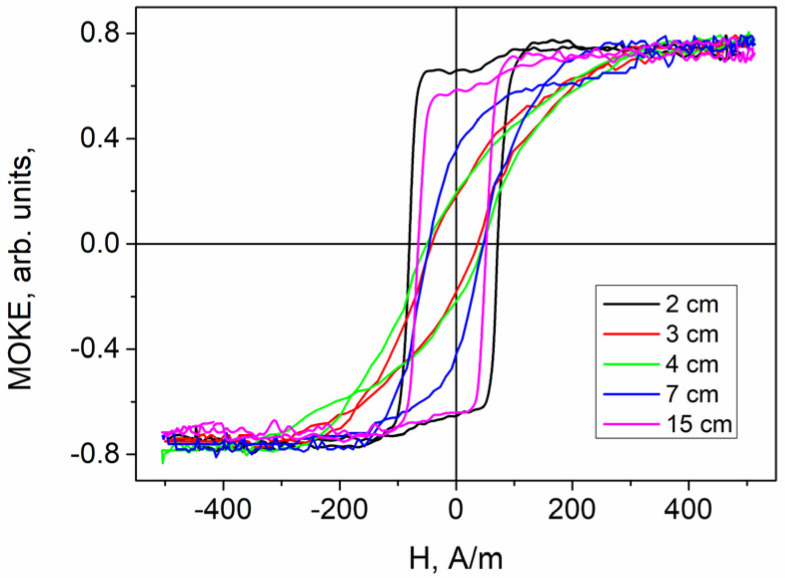
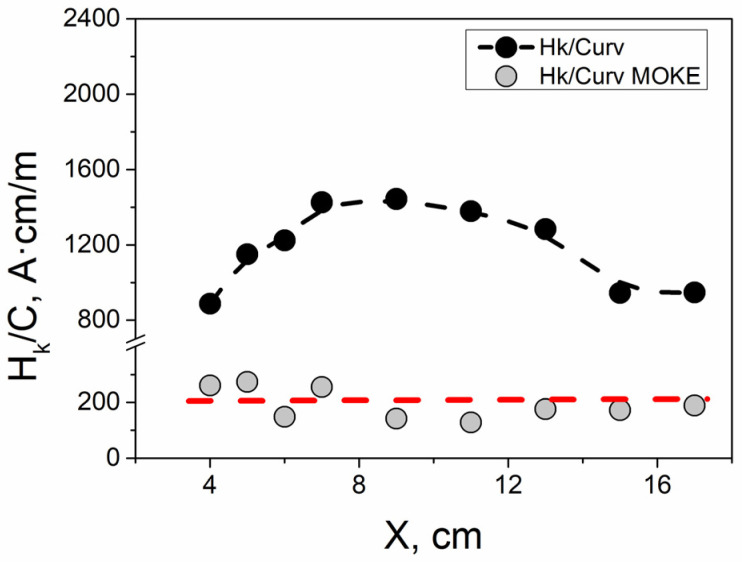
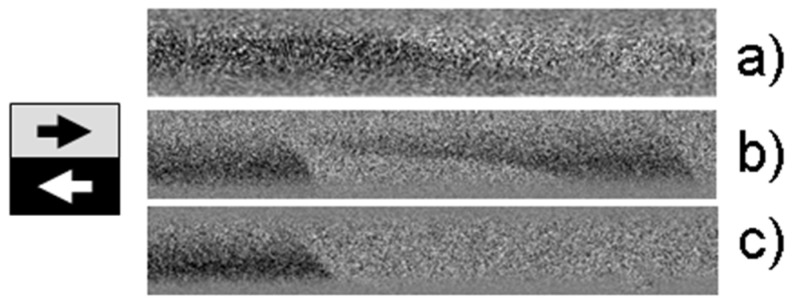
A preprocessing technique named "spiral annealing" was applied for the first time to magnetic microwires. In this process, the sample was arranged in a flat spiral shape during annealing, and subsequent measurements were conducted on the unbent sample with the induced stress distribution along and transverse to the sample. The research utilized both magnetic and magneto-optical methods. The anisotropy field magnitude in both the volume and surface of the microwire was measured, and for the first time, a direct correlation between the anisotropy field and the curvature of a spirally annealed microwire was established. Additionally, a connection between the type of surface domain structure and the degree of spiral curvature was identified. The preservation of the distribution of spiral annealing-induced magnetic properties both along and across the microwire is a key effect influencing the technological application of the microwire. The range of induced curvature within which a specific helical magnetic structure can exist was also determined. This insight links the conditions of spiral annealing to the selection of microwires as active elements in magnetic sensors.

Keywords: amorphous magnetic microwires; magnetic anisotropy; magnetic domains; magneto-optic Kerr effect; soft magnetic materials.


Conflict of interest statement

The authors declare no conflicts of interest.

Figures

Figure 1
Figure 1
Dependence of radius (a) and curvature (b) of the annealed sample on the distance X from the sample edge.
Figure 2
Figure 2
The schematic picture of sample preprocessing.
Figure 3
Figure 3
Fluxmetry hysteresis loops obtained at different points X along the length of the sample in long (a) and shorter (b) fields. Around a location of 5 cm (green line), saturation occurs at the maximum field value of about 1500 A/m (a). In this region of the spiral, the curvature is maximal. In short fields (b), one can see how the hysteresis loop becomes flatter in the middle part of the spiral (locations 9 cm, 13 cm).
Figure 4
Figure 4
MOKE hysteresis loops obtained in different locations X along the sample length. The hysteresis loops obtained at locations of 2 cm and 15 cm have a rectangular shape, which indicates a surface Barkhausen jump. The loops obtained at locations of 3 cm, 4 cm and 7 cm have a smoother shape, which indicates the presence of a surface helical structure.
Figure 5
Figure 5
Dependence of the anisotropy field values Hk on X location. The black dots were extracted from magnetic measurements, while the gray dots were extracted from the MOKE experiments. During annealing the spiral formally started at point X = 3 cm and was reliably determined at point X = 4 cm. The peak of the anisotropy field value was observed at point X = 5 cm for volume and at point X = 4 cm for surface measurements.
Figure 6
Figure 6
Distribution of bending stress in volume of sample (a) and in cross-section (b). Red and blue arrows show the direction of tensile and compressive stress, respectively. The stress value changes both in the sample volume and on the sample surface. In the case of spiral annealing, the absolute value of the induced stress decreases with increasing spiral radius (decreasing curvature).
Figure 7
Figure 7
Dependence of the anisotropy field normalized to the curvature values Hk/C on X location. The black dots were extracted from magnetic measurements, while the gray dots were extracted from the MOKE experiments. The red dashed line demonstrates that the magnitude of the surface anisotropy field is directly proportional to the geometric curvature of the sample.
Figure 8
Figure 8
Experimental results obtained using the Sixtus–Tonks technique. (a) EMF peaks corresponding to different location of measurement X. The transformation of the peak shape is observed depending on location X. (b) Comparison of peaks obtained in locations X = 5 cm and X = 17 cm. (c) Schematic picture of the experiment. The black arrow shows the direction of DW motion. At locations of 2 cm and 17 cm (a), single sharp peaks are observed, corresponding to the movement of single compact domain boundaries. The width of the peaks depends on the degree of inclination of the isolated domain wall. An additional wide peak corresponds to the running of the helical wall shown in Figure 9b.
Figure 9
Figure 9
Surface domain structures observed in studied sample. (a) X = 2 cm, (b) X = 5 cm, (c) X = 17 cm. Black–white arrows show the direction of the magnetization in the domains. (a,c) show images of single surface domain walls with different inclinations from the transverse direction. (b) shows a combination of a single elliptical domain wall and a helical domain wall.

References

    1. Zhukova V., Corte-Leon P., González-Legarreta L., Talaat A., Blanco J.M., Ipatov M., Olivera J., Zhukov A. Review of Domain Wall Dynamics Engineering in Magnetic Microwires. Nanomaterials. 2020;10:2407. doi: 10.3390/nano10122407. - DOI - PMC - PubMed
    1. Makhotkin V., Shurukhin B., Lopatin V., Marchukov P., Levin Y. Magnetic field sensors based on amorphous ribbons. Sens. Actuators A Phys. 1991;27:759–762. doi: 10.1016/0924-4247(91)87083-F. - DOI
    1. Morón C., Cabrera C., Morón A., García A., González M. Magnetic Sensors Based on Amorphous Ferromagnetic Materials: A Review. Sensors. 2015;15:28340–28366. doi: 10.3390/s151128340. - DOI - PMC - PubMed
    1. Phan M., Peng H. Giant magnetoimpedance materials: Fundamentals and applications. Prog. Mater. Sci. 2008;53:323–420. doi: 10.1016/j.pmatsci.2007.05.003. - DOI
    1. Nakayama S., Uchiyama T. Real-time Measurement of Biomagnetic Vector Fields in Functional Syncytium Using Amorphous Metal. Sci. Rep. 2015;5:8837. doi: 10.1038/srep08837. - DOI - PMC - PubMed

LinkOut - more resources