

Harmonic Vibration Analysis in a Simplified Model for Monitoring Transfemoral Implant Loosening
- PMID: 39409493
- PMCID: PMC11479371
- DOI: 10.3390/s24196453
Harmonic Vibration Analysis in a Simplified Model for Monitoring Transfemoral Implant Loosening
Abstract
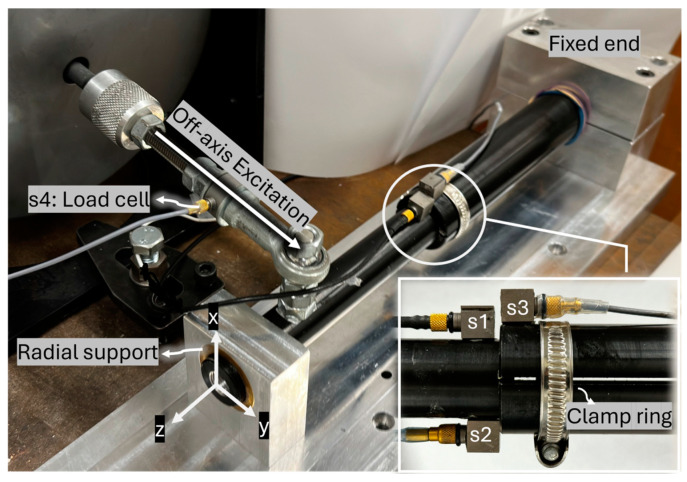
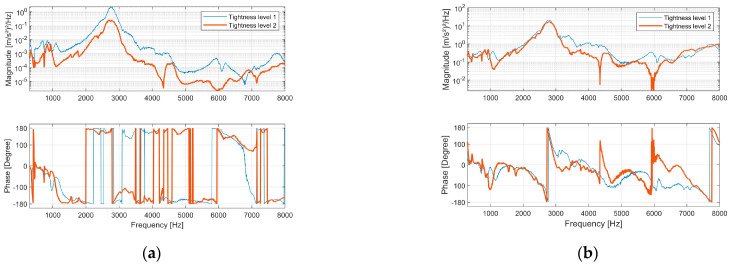
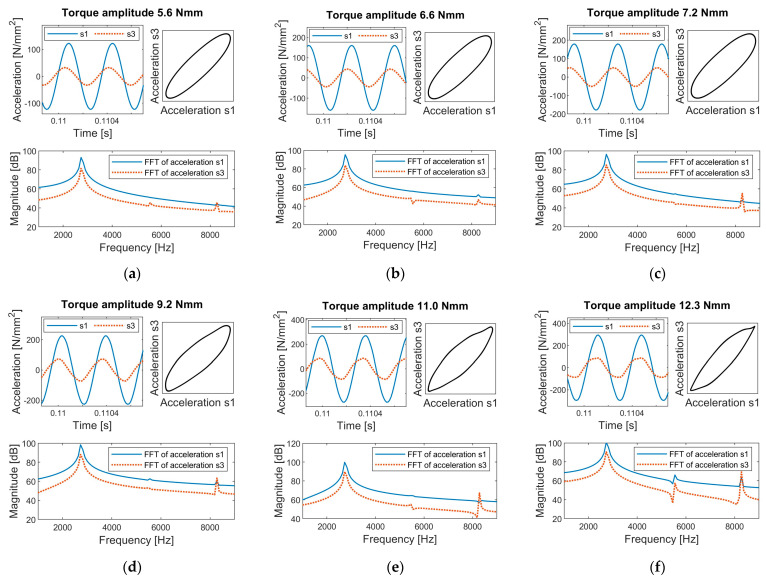
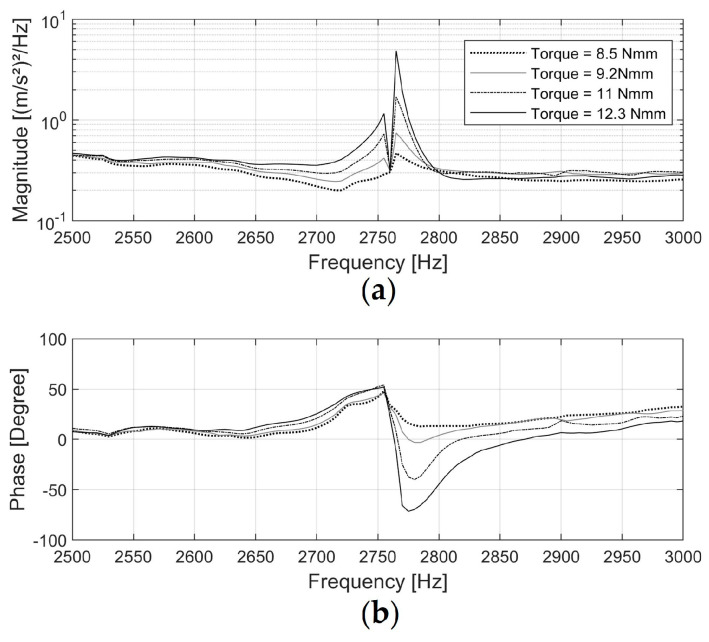
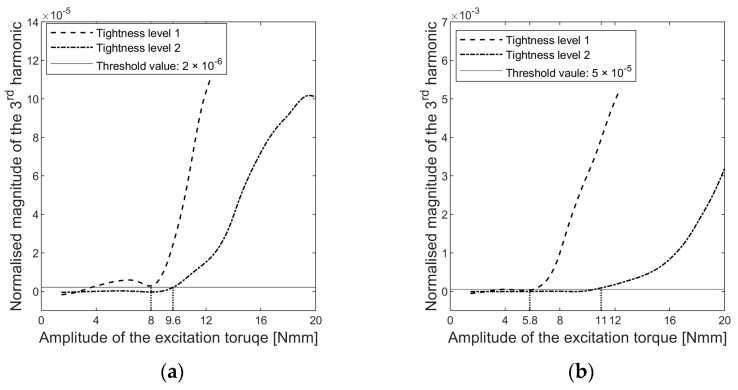
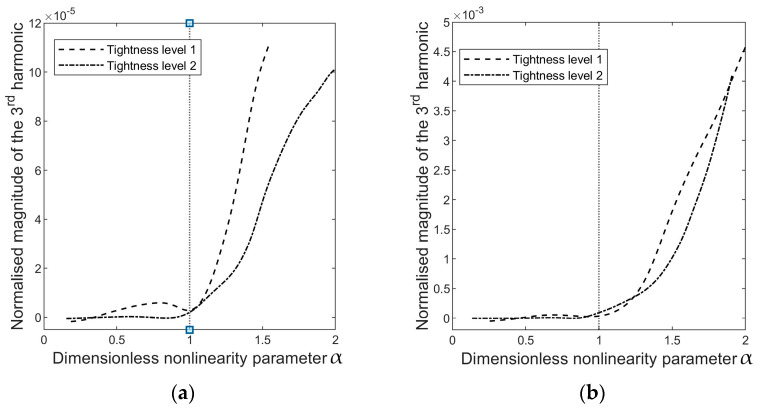
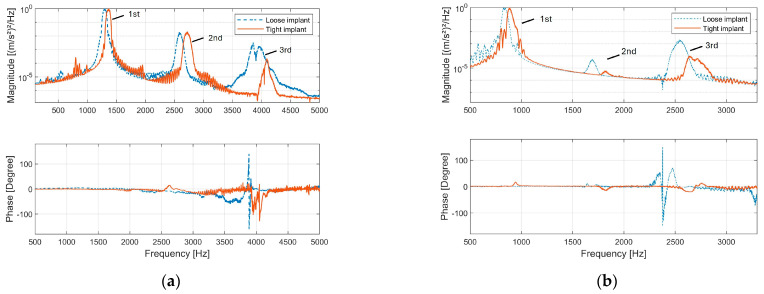
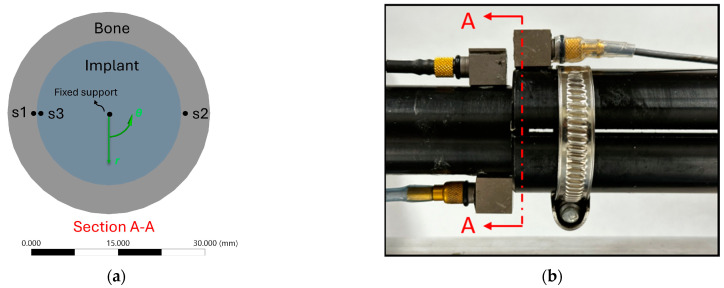
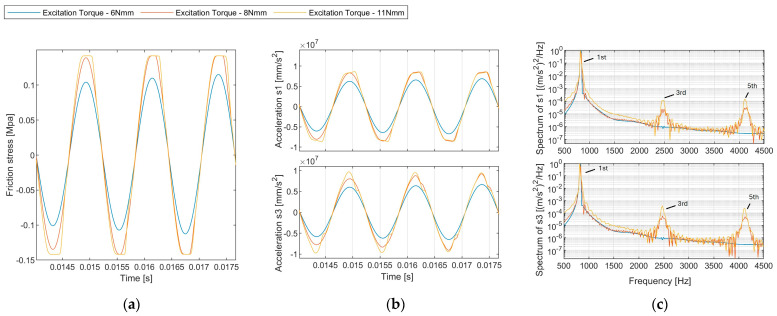
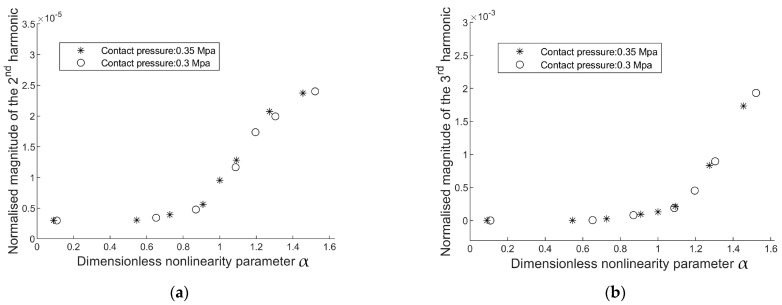
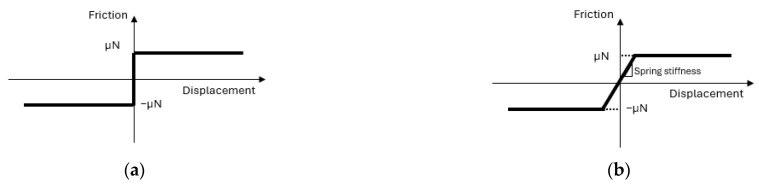
A simplified axisymmetric model of a transfemoral osseointegration implant was used to investigate the influence of the contact condition at the bone-implant interface on the vibrational response. The experimental setup allowed the degree of implant tightness to be controlled using a circumferential compression device affixed to the bone. Diametrically placed sensors allowed torsional modes to be distinguished from flexural modes. The results showed that the structural resonant frequencies did not shift significantly with tightness levels. The first torsional mode of vibration was found to be particularly sensitive to interface loosening. Harmonics in the vibrational response became prominent when the amplitude of the applied torque increased beyond a critical level. The torque level at which the third harmonic begins to rise correlated with implant criticality, suggesting a potential strategy for early detection of implant loosening based on monitoring the amplitude of the third harmonic of the torsional mode.
Keywords: bone–implant interface; osseointegration implant loosening; structural health monitoring; vibrational analysis.
Conflict of interest statement
The authors declare no conflict of interest.
Figures
Similar articles
-
Modal analysis for implant stability assessment: Sensitivity of this methodology for different implant designs.Dent Mater. 2018 Aug;34(8):1235-1245. doi: 10.1016/j.dental.2018.05.016. Epub 2018 Jun 8. Dent Mater. 2018. PMID: 29891196
-
Experimental Investigation of Vibration Analysis on Implant Stability for a Novel Implant Design.Sensors (Basel). 2022 Feb 21;22(4):1685. doi: 10.3390/s22041685. Sensors (Basel). 2022. PMID: 35214590 Free PMC article.
-
Load response of an osseointegrated implant used in the treatment of unilateral transfemoral amputation: An early implant loosening case study.Clin Biomech (Bristol). 2020 Mar;73:201-212. doi: 10.1016/j.clinbiomech.2020.01.017. Epub 2020 Jan 20. Clin Biomech (Bristol). 2020. PMID: 32036173
-
The limit of tolerable micromotion for implant osseointegration: a systematic review.Sci Rep. 2021 May 24;11(1):10797. doi: 10.1038/s41598-021-90142-5. Sci Rep. 2021. PMID: 34031476 Free PMC article.
-
Altering the Course of Technologies to Monitor Loosening States of Endoprosthetic Implants.Sensors (Basel). 2019 Dec 23;20(1):104. doi: 10.3390/s20010104. Sensors (Basel). 2019. PMID: 31878028 Free PMC article. Review.
References
-
- Hagberg K., Häggström E., Jönsson S., Rydevik B., Brånemark R. Osseoperception and Osseointegrated Prosthetic Limbs. In: Gallagher P., Desmond D., MacLachlan M., editors. Psychoprosthetics. Springer; London, UK: 2008. pp. 131–140.
MeSH terms
LinkOut - more resources
Full Text Sources
