Review
. 2024 Oct 8;24(19):6471.
doi: 10.3390/s24196471.

Recent Advancements in High-Frequency Ultrasound Applications from Imaging to Microbeam Stimulation

Affiliations
Review

Recent Advancements in High-Frequency Ultrasound Applications from Imaging to Microbeam Stimulation

Min Gon Kim et al. Sensors (Basel). .

Abstract

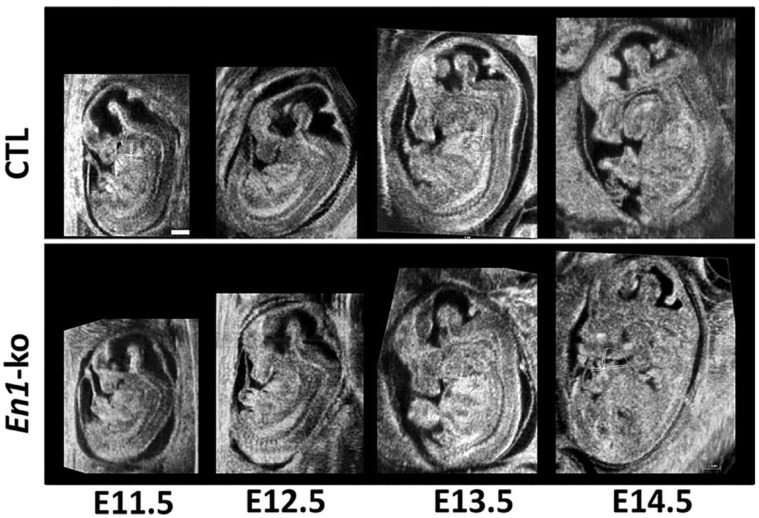
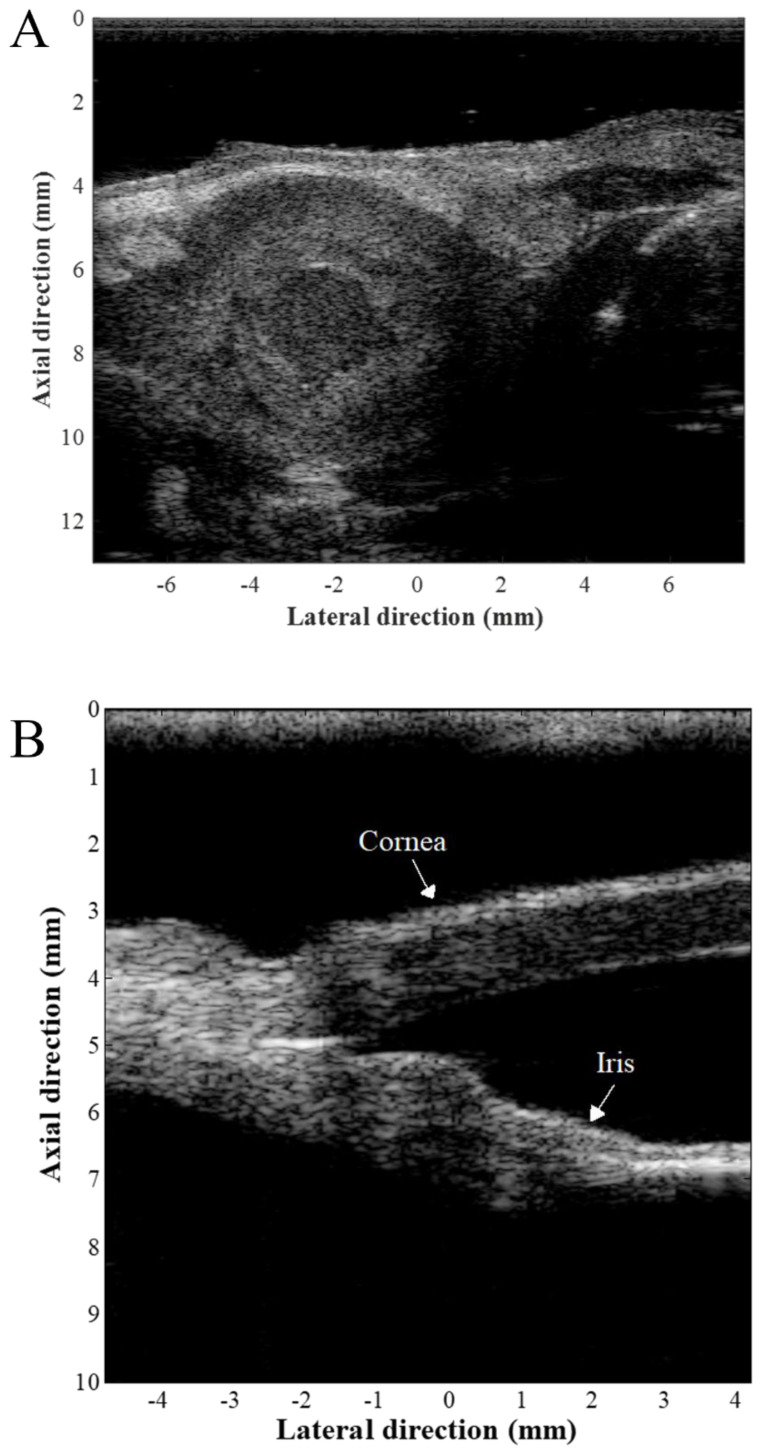
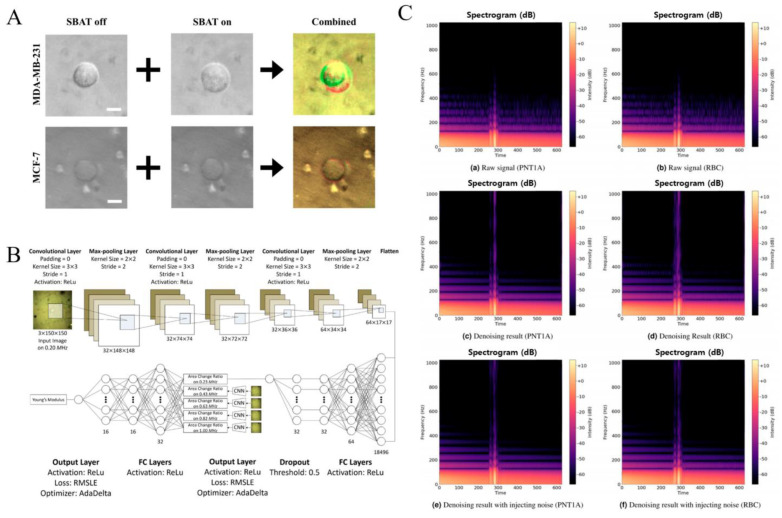
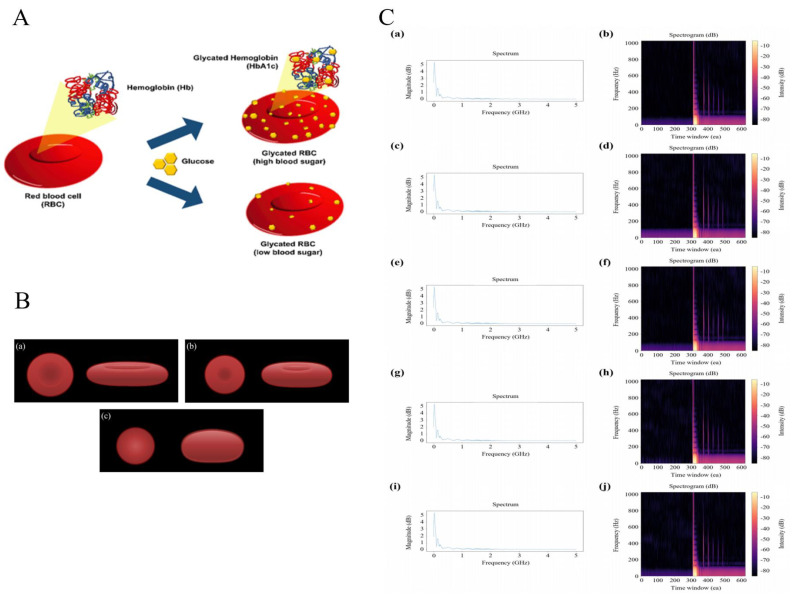
Ultrasound is a versatile and well-established technique using sound waves with frequencies higher than the upper limit of human hearing. Typically, therapeutic and diagnosis ultrasound operate in the frequency range of 500 kHz to 15 MHz with greater depth of penetration into the body. However, to achieve improved spatial resolution, high-frequency ultrasound (>15 MHz) was recently introduced and has shown promise in various fields such as high-resolution imaging for the morphological features of the eye and skin as well as small animal imaging for drug and gene therapy. In addition, high-frequency ultrasound microbeam stimulation has been demonstrated to manipulate single cells or microparticles for the elucidation of physical and functional characteristics of cells with minimal effect on normal cell physiology and activity. Furthermore, integrating machine learning with high-frequency ultrasound enhances diagnostics, including cell classification, cell deformability estimation, and the diagnosis of diabetes and dysnatremia using convolutional neural networks (CNNs). In this paper, current efforts in the use of high-frequency ultrasound from imaging to stimulation as well as the integration of deep learning are reviewed, and potential biomedical and cellular applications are discussed.

Keywords: high-frequency ultrasound imaging; high-frequency ultrasound microbeam; machine learning with high-frequency ultrasonic signals.


Conflict of interest statement

The authors declare no conflicts of interest.

Figures

Figure 1
Figure 1
In utero longitudinal high-frequency ultrasound images of control and En1-ko embryos over E11.5 and E14.5. E stands for embryonic day. Scale bar = 1 mm. Reprinted with permission from [25].
Figure 2
Figure 2
High–frequency ultrasound images of (A) a tumor–bearing mouse model and (B) an eye excised using a 30 MHz linear array. Reprinted with permission from [17,18].
Figure 3
Figure 3
Comparative analysis of image preprocessing, proposed CNN models, and denoising autoencoder performance in cell imaging (A). A comparison of original and preprocessed images shows that subtle deformations in MDA–MB–231 and MCF–7 cells become clearer after preprocessing. Noise is reduced, and cell boundaries are highlighted in red and green, making the images more robust. Scale bars represent 10 µm. Reproduced with permission [65], copyright 2020, MDPI (B). The proposed models for measuring area change ratios and estimating non-linear elastic moduli include a CNN model for area changes and an MLP model for non-linear elastic moduli. Reproduced with permission [66], copyright 2022, Nature Portfolio. (C) The results of the denoising autoencoder models show spectrograms for a PNT1A cell (left) and an RBC (right). The X-axis represents time, and the Y-axis represents frequency, with color brightness indicating intensity. (a,b) show the original signals, (c,d) display results from the 1D CNN denoising autoencoder, and (e,f) show the results with added Gaussian noise. Reproduced with permission [67], copyright 2022, Nature Portfolio.
Figure 4
Figure 4
Analysis of glycated hemoglobin, sodium-induced RBC variations, and spectral patterns across disease stages (A). Glycated red blood cells: Glucose binds with hemoglobin in red blood cells to form glycated hemoglobin (HbA1c), with the accumulation of HbA1c varying in relation to blood glucose levels. Reproduced with permission [68], copyright 2024, Elsevier (B). RBC changes due to sodium concentration: (a) hypernatremia–decreased volume, increased diameter; (b) normal; (c) hyponatremia–increased volume, decreased diameter. Reproduced with permission [69], copyright 2024, IEEE Inc. (C). Spectra and spectrograms for five stages of disease classification (125~185 µmol/mL): (a) spectrum at 125 µmol/mL, (b) spectrogram at 125 µmol/mL, (c) spectrum at 140 µmol/mL, (d) spectrogram at 140 µmol/mL, (e) spectrum at 145 µmol/mL, (f) spectrogram at 145 µmol/mL, (g) spectrum at 155 µmol/mL, (h) spectrogram at 155 µmol/mL, (i) spectrum at 185 µmol/mL, (j) spectrogram at 185 µmol/mL. Concentrations at each stage were chosen based on symptom onset or the threshold between normal and abnormal. Reproduced with permission [69], copyright 2024, IEEE Inc.

Similar articles

Cited by

References

    1. Shung K.K. Diagnostic Ultrasound: Imaging and Blood Flow Measurements. CRC Press; Boca Raton, FL, USA: 2006.
    1. Shung K.K. High frequency ultrasonic imaging. J. Med. Ultrasound. 2009;17:25–30. doi: 10.1016/S0929-6441(09)60012-6. - DOI - PMC - PubMed
    1. Turnbull D., Starkoski B.G., Harasiewicz K.A., Semple J.L., Gupta A.K., Sauder D.N., Foster F.S. A 40–100 MHz B-scan ultrasound backscatter microscope for skin imaging. Ultrasound Med. Biol. 1995;21:79–88. doi: 10.1016/0301-5629(94)00083-2. - DOI - PubMed
    1. Lockwood G.R., Turnbull D.H., Christopher D.A., Foster F.S. Beyond 30 MHz: Applications of high frequency ultrasonic imaging. IEEE Eng. Med. Biol. 1996;15:60–71. doi: 10.1109/51.544513. - DOI
    1. Passman C., Ermert H. A 100 MHz ultrasound imaging system for dermatologic and ophthalmologic diagnostics. IEEE Trans. Ultrason. Ferroelect. Freq. Control. 1996;43:545–552. doi: 10.1109/58.503714. - DOI

LinkOut - more resources