. 2024 Oct 5;14(19):2873.
doi: 10.3390/ani14192873.

Transcriptomic and Metabolomic Analyses Reveal the Attenuating Role of Cordycepin and Cordyceps militaris Extract on Acute Liver Injury Induced by LPS in Piglets

Affiliations

Transcriptomic and Metabolomic Analyses Reveal the Attenuating Role of Cordycepin and Cordyceps militaris Extract on Acute Liver Injury Induced by LPS in Piglets

Ding Tan et al. Animals (Basel). .

Abstract

Cordyceps militaris extract (CME) contains many bioactive compounds, mainly cordycepin (CPN). This study aimed to investigate the possible mechanisms underlying the amelioration of LPS-induced acute liver injury in piglets by CME or CPN supplementation using multi-omics analysis. Twenty-four weaned piglets were randomly distributed into 4 groups (n = 6): the control and LPS groups were fed basal diets; the CPN + LPS (CPN-LPS) and CME + LPS (CME-LPS) groups were fed the basal diets supplemented with CME or CPN. The results showed that CPN or CME supplementation significantly decreased the C-reactive protein level (p < 0.05) and improved liver tissue pathology to prevent acute liver injury after LPS treatment. Compared with LPS, the transcriptomic analysis indicated that CPN supplementation significantly downregulated cell adhesion molecules, while CME supplementation significantly downregulated inflammatory mediator regulation of TRP channels, complement and coagulation cascades and cytokine-cytokine receptor interaction. The metabolomic results showed that CPN or CME supplementation significantly reduced disease biomarker of bicyclo-prostaglandin E2, and increased levels of deoxyinosine and 3-hydroxyanthranilic acid (p < 0.05). The combined transcriptome and metabolome helped identify two metabolites PC 34:2 and PC 36:0, which may be associated with the restoration of liver cell morphology. In conclusion, CPN and CME could attenuate LPS-induced acute liver injury by regulating immune-related genes and metabolites. This study elucidates the potential protective mechanism of CPN or CME supplementation against acute liver injury.

Keywords: Cordyceps militaris extract; cordycepin; liver injury; metabolomics and transcriptomics; piglets.


Conflict of interest statement

The authors declare no conflicts of interest.

Figures

Figure 1
Figure 1
The alleviation of Cordyceps militaris extract and cordycepin on liver injury induced by LPS in piglets. CON: control group, LPS: LPS injection group, CPN-LPS: cordycepin (CPN) supplementation + LPS injection group, CME-LPS: Cordyceps militaris extract (CME) supplementation + LPS injection group. (A) Aspartate aminotransferase (AST) level in serum. (B) Alanine aminotransferase (ALT) level in serum. (C) C-reactive protein (CRP) level in serum and liver. (D) Haptoglobin (HP) level in serum and liver. (E) The histopathological changes in liver tissues of H&E staining (200×), scale bar with 100 μm. (F) The injury score of liver. Data were expressed as mean ± SEM (n = 6). Statistical significance was determined by One-way ANOVA analysis. * p < 0.05, ** p < 0.01, *** p < 0.001.
Figure 2
Figure 2
Transcriptome analysis of piglet liver (n = 3). CON: control group, LPS: LPS injection group, CPN-LPS: cordycepin (CPN) supplementation + LPS injection group, CME-LPS: Cordyceps militaris extract (CME) supplementation + LPS injection group. (A) Correlation analysis of gene expression of samples. (B) Venn diagram. Volcanic diagram of LPS vs. CON (C), CPN-LPS vs. LPS (D) and CME-LPS vs. LPS (E).
Figure 3
Figure 3
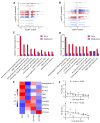
Pathway enrichment analysis of transcriptome. CON: control group, LPS: LPS injection group, CPN-LPS: cordycepin (CPN) supplementation + LPS injection group, CME-LPS: Cordyceps militaris extract (CME) supplementation + LPS injection group. (A) Top 20 KEGG enrichment analysis of upregulated DEGs in LPS vs. CON. KEGG analysis of upregulated and downregulated DEGs of CPN-LPS vs. LPS (B) and CME-LPS vs. LPS (C). (D) Heatmap of immune-related genes in the KEGG enrichment pathway of CPN-LPS vs. LPS and CME-LPS vs. LPS.
Figure 4
Figure 4
Metabolome analysis of piglet liver (n = 6). CON: control group, LPS: LPS injection group, CPN-LPS: cordycepin (CPN) supplementation + LPS injection group, CME-LPS: Cordyceps militaris extract (CME) supplementation + LPS injection group. (A) PCA plot. OPLS-DA plot of LPS vs. CON (B), CPN-LPS vs. LPS (C) and CME-LPS vs. LPS (D). (E) Changes of liver DEMs. (F) Cluster heatmap of differential metabolites. (G) Relative abundance of selected potential metabolites biomarkers. Statistical significance was determined by Student’s t-test. * p < 0.05, ** p < 0.01.
Figure 5
Figure 5
KEGG enrichment analysis of LPS vs. CON (A), CPN-LPS vs. LPS (B) and CME-LPS vs. LPS (C).
Figure 6
Figure 6
Integration analysis of transcriptome and metabolome. CON: control group, LPS: LPS injection group, CPN-LPS: cordycepin (CPN) supplementation + LPS injection group, CME-LPS: Cordyceps militaris extract (CME) supplementation + LPS injection group. The nine-quadrant plots show the correlation between DEGs and DEM in CPN-LPS vs. LPS (A) and CME-LPS vs. LPS (B). Pearson correlation of differential genes and metabolites (n = 3). p < 0.05, R > 0.8. Each point represents DEGs and DEMs pairs, blue and red points indicate DEGs and DEMs pairs and DEGs and non-DEM pairs, respectively. The absolute value corresponding to the dashed lines on the horizontal and vertical axes is 1, which signifies that the FC of the genes or metabolites is 2 or 0.5. Quadrants one to nine are ordered from left to right and top to bottom. Quadrants 1, 3, 7, and 9 with blue points represent DEGs and DEMs. Quadrants 4 and 6 with red points represent DEGs and non-DEMs. Quadrants 2 and 8 represent non-DEGs and DEMs, while quadrant 5 represents non-DEGs and non-DEMs. The top 10 KEGG common pathways with the highest number of DEGs and DEMs in CPN-LPS vs. LPS (C) and CME-LPS vs. LPS (D) mapped to the KEGG. (E) Heatmap of DEMs and DEGs of arachidonic acid metabolism. (F) Correlation analysis between relative abundance of PC 34:2 and PC 36:0 and liver injury score.

Similar articles

References

    1. Nolan J.P. The role of intestinal endotoxin in liver injury: A long and evolving history. Hepatology. 2010;52:1829–1835. doi: 10.1002/hep.23917. - DOI - PubMed
    1. Rathinam V.A.K., Zhao Y., Shao F. Innate immunity to intracellular LPS. Nat. Immunol. 2019;20:527–533. doi: 10.1038/s41590-019-0368-3. - DOI - PMC - PubMed
    1. Duan G., Huang P., Zheng C., Zheng J., Yu J., Zhang P., Wan M., Li F., Guo Q., Yin Y., et al. Development and Recovery of Liver Injury in Piglets by Incremental Injection of LPS. Antioxidants. 2023;12:1143. doi: 10.3390/antiox12061143. - DOI - PMC - PubMed
    1. Zhao D.D., Wang J.J., Fan J.J., Fu Y., Ma Y.D., Li C., Wu G.F., Liu M., Lin S.M., Hu J.M. Taurine Prevents LPS-Induced Liver Injury in Weaned Piglets. Adv. Exp. Med. Biol. 2022;1370:497–505. doi: 10.1007/978-3-030-93337-1_45. - DOI - PubMed
    1. Machado M.V., Diehl A.M. Pathogenesis of Nonalcoholic Steatohepatitis. Gastroenterology. 2016;150:1769–1777. doi: 10.1053/j.gastro.2016.02.066. - DOI - PMC - PubMed

LinkOut - more resources