. 2024 Sep 24;16(19):3252.
doi: 10.3390/cancers16193252.

Benchmarking of Approaches for Gene Copy-Number Variation Analysis and Its Utility for Genetic Aberration Detection in High-Grade Serous Ovarian Carcinomas

Affiliations

Benchmarking of Approaches for Gene Copy-Number Variation Analysis and Its Utility for Genetic Aberration Detection in High-Grade Serous Ovarian Carcinomas

Pavel Alekseevich Grebnev et al. Cancers (Basel). .

Abstract

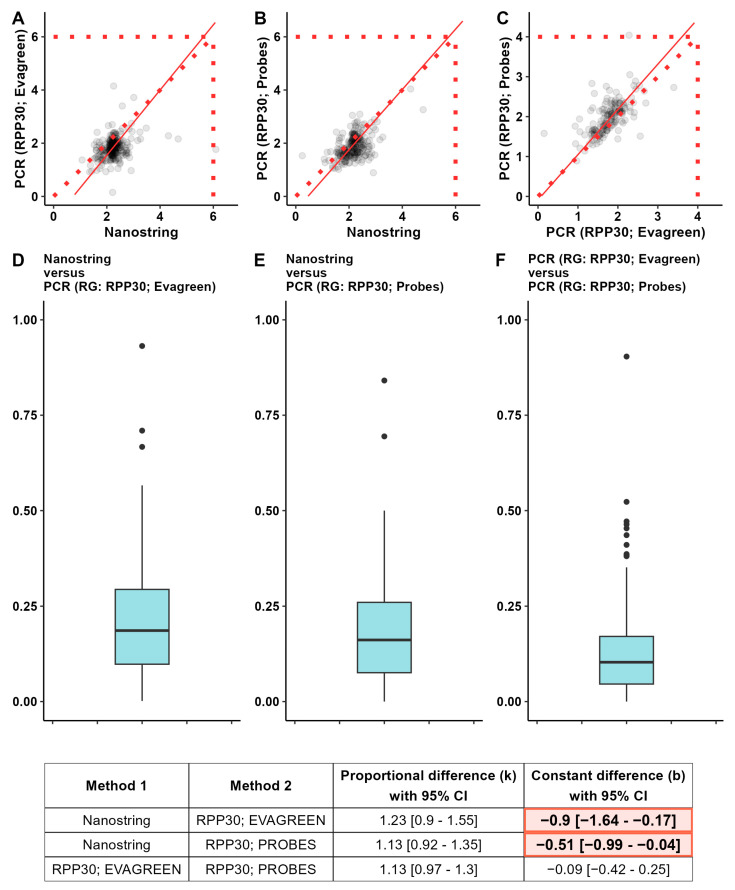
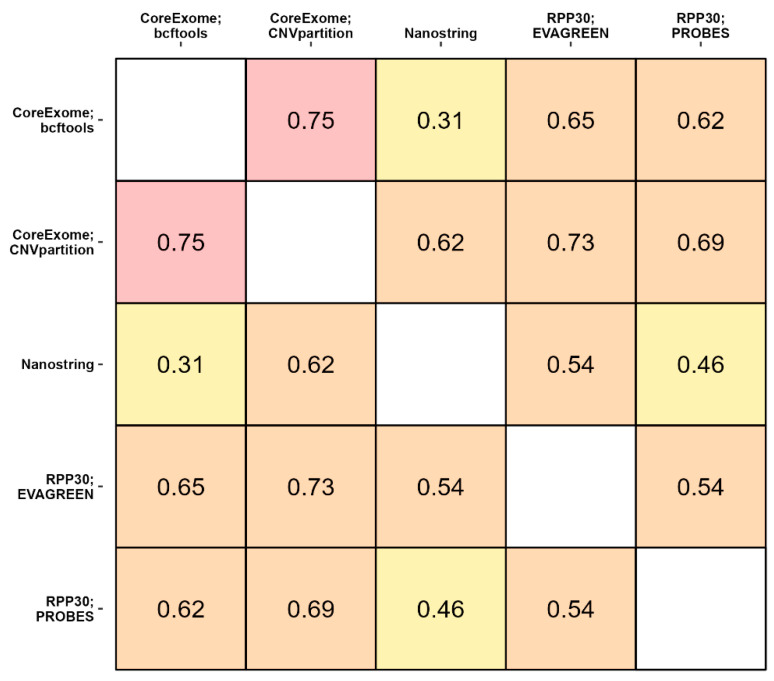
Objective: The goal of this study was to compare the results of CNV detection by three different methods using 13 paired carcinoma samples, as well as to perform a statistical analysis of the agreement. Methods: CNV was studied using NanoString nCounter v2 Cancer CN Assay (Nanostring), Illumina Infinium CoreExome microarrays (CoreExome microarrays) and digital droplet PCR (ddPCR). Results: There was a good level of agreement (PABAK score > 0.6) between the CoreExome microarrays and the ddPCR results for finding CNVs. There was a moderate level of agreement (PABAK values ≈ 0.3-0.6) between the NanoString Assay results and microarrays or ddPCR. For 83 out of 87 target genes studied (95%), the agreement between the CoreExome microarrays and NanoString nCounter was characterized by PABAK values < 0.75, except for MAGI3, PDGFRA, NKX2-1 and KDR genes (>0.75). The MET, HMGA2, KDR, C8orf4, PAX9, CDK6, and CCND2 genes had the highest agreement among all three approaches. Conclusions: Therefore, to get a better idea of how to genotype an unknown CNV spectrum in tumor or normal tissue samples that are very different molecularly, it makes sense to use at least two CNV detection methods. One of them, like ddPCR, should be able to quantitatively confirm the results of the other.

Keywords: CoreExome DNA microarray; HGSC; NanoString CNV panel; PABAK; benchmarking; digital droplet PCR (ddPCR); gene copy number variation; high-grade serous carcinoma; ovarian cancer.


Conflict of interest statement

The authors declare no conflicts of interest.

Figures

Figure A1
Figure A1
Overall survival rates of patients with ovarian cancer depending on the amplification of any of the three target genes TCIM, PAX9, and CCND2. A survival assessment was conducted using cBioPortal [97] based on public data from ovarian cancer studies (dataset: ovarian serous cystadenocarcinoma, TCGA). The log-rank test is used to test the null hypothesis that there is no difference between the groups in the probability of an event at any time point. Hazard ratios (HR) are derived from the log-rank test. The altered group (red color) represents the samples, n = 93, with at least one amplification in the queried genes. The unaltered group (blue color) includes samples (n = 471) without any alteration in the queried genes.
Figure A2
Figure A2
The consistency between the methods of copy number identification measured by prevalence-adjusted and bias-adjusted Kappa coefficients (PABAK). Rows correspond to the compared methods and columns correspond to the studied genes. The sort order is decreasing according to the median PABAK value per gene, from highest to lowest.
Figure 1
Figure 1
The consistency between the methods of copy number identification measured by prevalence-adjusted and bias-adjusted Kappa coefficients (PABAK). The three wide panels are the tables whose rows correspond to the compared methods and whose columns correspond to the studied genes. The sort order is decreasing according to the median PABAK value per gene, from highest to lowest.
Figure 2
Figure 2
Preliminary descriptive statistics of PCR-analysis results for normal tissue. Copy number values are presented for the genes of interest. The red color depicts groups of observations that were excluded from further consideration.
Figure 3
Figure 3
The consistency between the methods of copy number identification measured by Passing–Bablock regression and by the magnitude of the relative discrepancy di. Three methods were considered: the NanoString CNV panel, the PCR-based technique with TaqMan probes, and the PCR-based technique with EvaGreen dye. RPP30 has been used for both PCR analyses as a reference gene. Panels (AC) are the scatterplots depicting the results of the Passing–Bablock regression. The panels (DF) are the boxplots representing the distribution of relative discrepancy di. The lower the di is to zero, the better the consistency of the two methods. The coefficients of the Passing–Bablock regression models are presented in the bottom table, along with their respective 95% confidence intervals. The shaded cells represent the observed constant differences between the compared results of the two methods. The abbreviation RG means «reference gene».
Figure 4
Figure 4
Changes in copy number values of genes of pane1 according to the PCR analysis. We used a PCR-based technique with TaqMan probes and RPP30 as a reference gene. The horizontal axis corresponds to the patient identifier, and the vertical axis to the genes of interest.
Figure 5
Figure 5
Pairwise consistency between the methods of copy number identification. The prevalence-adjusted and bias-adjusted Kappa coefficient (PABAK) has been used as a measure of consistency.

Similar articles

Cited by

References

    1. PCAWG Transcriptome Core Group. Calabrese C., Davidson N.R., Demircioğlu D., Fonseca N.A., He Y., Kahles A., Lehmann K.-V., Liu F., Shiraishi Y., et al. Genomic Basis for RNA Alterations in Cancer. Nature. 2020;578:129–136. doi: 10.1038/s41586-020-1970-0. - DOI - PMC - PubMed
    1. Steele C.D., Abbasi A., Islam S.M.A., Bowes A.L., Khandekar A., Haase K., Hames-Fathi S., Ajayi D., Verfaillie A., Dhami P., et al. Signatures of Copy Number Alterations in Human Cancer. Nature. 2022;606:984–991. doi: 10.1038/s41586-022-04738-6. - DOI - PMC - PubMed
    1. Harbers L., Agostini F., Nicos M., Poddighe D., Bienko M., Crosetto N. Somatic Copy Number Alterations in Human Cancers: An Analysis of Publicly Available Data From The Cancer Genome Atlas. Front. Oncol. 2021;11:700568. doi: 10.3389/fonc.2021.700568. - DOI - PMC - PubMed
    1. Huang T., Li J., Jia B., Sang H. CNV-MEANN: A Neural Network and Mind Evolutionary Algorithm-Based Detection of Copy Number Variations From Next-Generation Sequencing Data. Front. Genet. 2021;12:700874. doi: 10.3389/fgene.2021.700874. - DOI - PMC - PubMed
    1. Andor N., Maley C.C., Ji H.P. Genomic Instability in Cancer: Teetering on the Limit of Tolerance. Cancer Res. 2017;77:2179–2185. doi: 10.1158/0008-5472.CAN-16-1553. - DOI - PMC - PubMed