. 2024 Oct 4;16(19):3393.
doi: 10.3390/cancers16193393.

Combined PET Radiotracer Approach Reveals Insights into Stromal Cell-Induced Metabolic Changes in Pancreatic Cancer In Vitro and In Vivo

Affiliations

Combined PET Radiotracer Approach Reveals Insights into Stromal Cell-Induced Metabolic Changes in Pancreatic Cancer In Vitro and In Vivo

Alina Doctor et al. Cancers (Basel). .

Abstract

Background/Objective Pancreatic stellate cells (PSCs) in pancreatic adenocarcinoma (PDAC) are producing extracellular matrix, which promotes the formation of a dense fibrotic microenvironment. This makes PDAC a highly heterogeneous tumor-stroma-driven entity, associated with reduced perfusion, limited oxygen supply, high interstitial fluid pressure, and limited bioavailability of therapeutic agents. Methods In this study, spheroid and tumor xenograft models of human PSCs and PanC-1 cells were characterized radiopharmacologically using a combined positron emission tomography (PET) radiotracer approach. [18F]FDG, [18F]FMISO, and [18F]FAPI-74 were employed to monitor metabolic activity, hypoxic metabolic state, and functional expression of fibroblast activation protein alpha (FAPα), a marker of activated PSCs. Results In vitro, PanC-1 and multi-cellular tumor spheroids demonstrated comparable glucose uptake and hypoxia, whereas FAPα expression was significantly higher in PSC spheroids. In vivo, glucose uptake as well as the transition to hypoxia were comparable in PanC-1 and multi-cellular xenograft models. In mice injected with PSCs, FAPα expression decreased over a period of four weeks post-injection, which was attributed to the successive death of PSCs. In contrast, FAPα expression increased in both PanC-1 and multi-cellular xenograft models over time due to invasion of mouse fibroblasts. Conclusion The presented models are suitable for subsequently characterizing stromal cell-induced metabolic changes in tumors using noninvasive molecular imaging techniques.

Keywords: radionuclide theranostics; radiotracers; small animal positron emission tomography; spheroids; tumor microenvironment; xenograft models.


Conflict of interest statement

The authors declare no conflicts of interest.

Figures

Figure 1
Figure 1
Schematic illustration of the mode of action of the PET radiotracers [18F]FDG, [18F]FMISO (fluoromisonidazole), and [18F]FAPI-74. In addition to tumor cells, the tumor shown here also consists of PSCs and mouse fibroblasts (mF). The tumor consists of a metabolically active and normoxic marginal zone (pink), while the inner core represents a hypoxic region (brown). [18F]FDG (cyan circles) is taken up by the glucose transporter 1 (GLUT-1) transporter and metabolized by hexokinases (HK), then becoming trapped (red circle) in metabolically active regions of the tumor. [18F]FMISO binds to macromolecules (blue circle) in the hypoxic region. To target the tumor stroma, [18F]FAPI-74 can be used. The tracer binds to FAPα in cancer-associated fibroblasts. Created in BioRender. Doctor, A. (2024) BioRender.com/b29q105.
Figure 2
Figure 2
Characterization of spheroid models. (A) Representative spheroid images of HPaSteC, PanC-1, and MCTS after 1, 4, and 7 days of incubation. Scale bar corresponds to 100 µm. (B,C) In vitro radiotracer uptake assay with HPaSteC, PanC-1, and MCTS spheroids. Percentage of injected dose per µg (mean + SD) and statistical difference *: HPaSteC vs. PanC-1, #: HPaSteC vs. MCTS (p < 0.05, two-way ANOVA). (B) time-dependent [18F]FDG uptake. (C) [18F]FMISO uptake in normoxic and hypoxic conditions after 4 h of incubation. Statistical difference (* p < 0.05, ** p < 0.0021 two-way ANOVA).
Figure 3
Figure 3
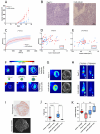
Characteristics of PanC-1 and multi-cellular xenografts. (A) Growth curve of subcutaneous tumors in SCID beige mice after injection of PanC-1 cells and multi-cellular xenografts (mean ± SD, n = 15). (B) Representative histological images of H&E staining. (C) Dynamic PET measurements of [18F]FDG. (D) PET measurements depicting the SUVmean of [18F]FDG and (E) [18F]FMISO in PanC-1 and multi-cellular tumor-bearing SCID mice versus tumor volume in cm3 and Pearson’s correlation (r). (F) Illustration of size-dependent core formation. [18F]FDG PET showing metabolically active tumor regions (top row) and [18F]FMISO PET in the same mouse showing hypoxic tumor microenvironment (bottom row). The middle row illustrates the tumor size-dependent extent of metabolically active rim and hypoxic core. (G) Exemplary comparison between [18F]FDG PET imaging and fluorescent dye Hoechst 33342 for vascularization imaging. For better visibility, the blue channel was changed to white. (H) Sequential [18F]FDG and [18F]FMISO PET images of mice bearing xenograft tumors (white arrows). (I) Representative image of Hoechst 33342 fluorescence for blood vessel staining and pimonidazole staining for hypoxia. (J) Percentage of pimonidazole-positive tumor area and Hoechst fluorescence (K) in the tumor margin and core. Statistical analysis with one-way ANOVA (p * 0.0332, ** 0.0021, **** < 0.0001).
Figure 4
Figure 4
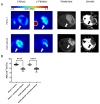
PET and MRI imaging reflect hypoxia and connective tissue. (A) Sequential [18F]FDG and [18F]FMISO PET images of mice bearing xenograft tumors in comparison of T2 weighted MRI (TRARE) and diffusion weighted MRI (DW) images. Arrows indicating the tumor lesion. (B) ADC values calculated for DW-MRI images with significant differences of **** p < 0.0001 (One-way ANOVA).
Figure 5
Figure 5
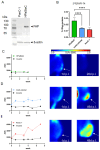
[18F]FAPI-74 as a PSC marker. (A) FAPα expression was determined via Western blot using cell lysates. (B) [18F]FAPI-74 uptake by spheroids after 30 min. Statistical analysis with one-way ANOVA (**** p < 0.0001, n = 15). In vivo [18F]FAPI-74 uptake in HPaSteC (C), multi-cellular (D), and PanC-1 (E) xenograft tumor shown as Area under curve (AUC) in the course of 7 weeks and the corresponding PET images to the indicated time points after injection. The white arrow indicates the injection site. The original Western blot figures can be found in Supplemental Materials Figure S6.
Figure 6
Figure 6
(A) Representative immunohistological images of markers for murine and human FAP, human nuclear mitotic antigen (NuMa), α-SMA (smooth muscle actin), human and murine Collagen I, and Cytokeratin 19 (KRT19). Staining control was performed using rabbit isotype antibody. Hematoxylin counterstains the cell nuclei in blue, and positive immunohistological staining is red. (B) Quantitative analysis of immunohistological positive staining with ImageJ (significant differences calculated with t-test p < 0.05, * 0.0332, *** 0.0002, **** <0.0001). (C) Sequential immunohistological staining of α-SMA and human cell nuclei in multi-cellular and PanC-1 xenograft tumors. Black arrows indicate blue nuclei corresponding to positive α-SMA staining. (D) Western blot shows α-SMA protein expression in monolayer cultured HPaSteC and in xenograft PanC-1 and multi-cellular tumors and none in PanC-1 cells. β-actin was used as loading control. The original Western blot figures can be found in Supplemental Materials Figure S7.
Figure 7
Figure 7
Schematic representation of a subcutaneous PDAC+PSC tumor. Injected tumor cells attract mouse fibroblasts. As the tumor cells divide, more mouse fibroblasts invade the growing tumor mass, and the human pancreatic stellate cells become overgrown. Created in BioRender. Doctor, A. (2024) BioRender.com/k83f778.

References

    1. Li C., Morvaridi S., Lam G., Chheda C., Kamata Y., Katsumata M., Edderkaoui M., Yuan X., Nissen N., Pandol S.J., et al. MSP-RON Signaling Is Activated in the Transition From Pancreatic Intraepithelial Neoplasia (PanIN) to Pancreatic Ductal Adenocarcinoma (PDAC) Front. Physiol. 2019;10:147. doi: 10.3389/fphys.2019.00147. - DOI - PMC - PubMed
    1. Large T.Y.S.L., Bijlsma M.F., Kazemier G., Laarhoven H.W.M.v., Giovannetti E., Jimenez C.R. Key biological processes driving metastatic spread of pancreatic cancer as identified by multi-omics studies. Semin. Cancer Biol. 2017;44:153–169. doi: 10.1016/j.semcancer.2017.03.008. - DOI - PubMed
    1. Guo X.-Z., Cui Z.-M., Liu X. Current developments, problems and solutions in the non-surgical treatment of pancreatic cancer. World J. Gastrointest. Oncol. 2013;5:20. doi: 10.4251/wjgo.v5.i2.20. - DOI - PMC - PubMed
    1. Vasseur S., Guillaumond F. LDL Receptor: An open route to feed pancreatic tumor cells. Mol. Cell. Oncol. 2015;3:e1033586. doi: 10.1080/23723556.2015.1033586. - DOI - PMC - PubMed
    1. Apte M.V., Pirola R.C., Wilson J.S. Pancreatic stellate cells: A starring role in normal and diseased pancreas. Front. Physiol. 2012;3:344. doi: 10.3389/fphys.2012.00344. - DOI - PMC - PubMed

LinkOut - more resources