. 2024 Dec 1;110(12):7749-7762.
doi: 10.1097/JS9.0000000000002118.

An immune signature of postoperative cognitive decline: a prospective cohort study

Affiliations

An immune signature of postoperative cognitive decline: a prospective cohort study

Franck Verdonk et al. Int J Surg. .

Abstract

Background: Postoperative cognitive decline (POCD) is the predominant complication affecting patients over 60 years old following major surgery, yet its prediction and prevention remain challenging. Understanding the biological processes underlying the pathogenesis of POCD is essential for identifying mechanistic biomarkers to advance diagnostics and therapeutics. This study aimed to provide a comprehensive analysis of immune cell trajectories differentiating patients with and without POCD and to derive a predictive score enabling the identification of high-risk patients during the preoperative period.

Material and methods: Twenty-six patients aged 60 years old and older undergoing elective major orthopedic surgery were enrolled in a prospective longitudinal study, and the occurrence of POCD was assessed 7 days after surgery. Serial samples collected before surgery, and 1, 7, and 90 days after surgery were analyzed using a combined single-cell mass cytometry and plasma proteomic approach. Unsupervised clustering of the high-dimensional mass cytometry data was employed to characterize time-dependent trajectories of all major innate and adaptive immune cell frequencies and signaling responses. Sparse machine learning coupled with data-driven feature selection was applied to the presurgery immunological dataset to classify patients at risk for POCD.

Results: The analysis identified cell-type and signaling-specific immune trajectories differentiating patients with and without POCD. The most prominent trajectory features revealed early exacerbation of JAK/STAT and dampening of inhibitory κB and nuclear factor-κB immune signaling responses in patients with POCD. Further analyses integrating immunological and clinical data collected before surgery identified a preoperative predictive model comprising one plasma protein and 10 immune cell features that classified patients at risk for POCD with excellent accuracy (AUC=0.80, P =2.21e-02 U -test).

Conclusion: Immune system-wide monitoring of patients over 60 years old undergoing surgery unveiled a peripheral immune signature of POCD. A predictive model built on immunological data collected before surgery demonstrated greater accuracy in predicting POCD compared to known clinical preoperative risk factors, offering a concise list of biomarker candidates to personalize perioperative management.


Conflict of interest statement

J.H., B.G., and F.V. are listed as inventors on a patent application (PCT/US2023/074903). J.H., B.G., D.G., and F.V. are advisory board members, G.B. is employed, and E.G. is a consultant at SurgeCare SAS. The remaining authors declare no competing interests.

Sponsorships or competing interests that may be relevant to content are disclosed at the end of this article.

Figures

Figure 1
Figure 1
Study design for combined single-cell and plasma proteomic immune profiling of postoperative cognitive decline (POCD). A. Peripheral blood samples were collected from 26 patients undergoing primary hip replacement surgery at four timepoints: before surgery at day (D)0 and on postoperative day (POD)1, POD7, and POD90. Among them, 11 patients developed POCD 7 days after surgery (POCD group), while 15 did not (control group). B. Longitudinal analysis of immune cell trajectories differentiating the POCD and control groups was performed using single-cell mass cytometry. C. In addition, a multivariable predictive modeling approach integrating the plasma proteomic (SOMAscan manual assay), single-cell proteomic (cytometry by time of flight mass spectrometry, CyTOF), and clinical datasets obtained before surgery (D0) was employed to identify preoperative biomarker candidates predictive of POCD. LPS, lipopolysaccharide.
Figure 2
Figure 2
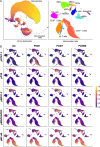
Longitudinal analysis of immune cell events before and after surgery with mass cytometry reveals cell-type and signaling-specific responses. A. Uniform manifold approximation and projection (UMAP) representation of the single-cell mass cytometry dataset. Upper panel: all live leukocytes, including neutrophils and mononuclear cells; lower panel: UMAP representation of mononuclear cells only. UMAPS are clustered by cell types and annotated. B. UMAPs representing all mononuclear cells colored according to intracellular signaling at D0 (before surgery), POD1, POD7, and POD90. cMCs, classical monocytes; CREB, cAMP-response element binding protein; T cells, gamma delta T cells; IκB, inhibitor of κB; intMCs, intermediate monocytes; mDCs, myeloid dendritic cells; MDSCs, myeloid-derived suppressor cells; NF-κB, nuclear factor-κB; ncMCs, nonclassical monocytes; NK, natural killer; pDCs, plasmacytoid dendritic cells; p, phosphorylated; JAK/STAT, Janus kinase/signal transducer and activator of transcription; rpS6, ribosomal protein S6.
Figure 3
Figure 3
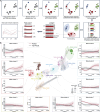
Longitudinal analysis identifies immune cell trajectories differentiating patients who later developed POCD from controls. A. Identification of immune cell feature clusters behaving synchronously in response to surgery (meta-clusters): An original dataset is constructed with a size of 4n x p, where ‘n’ represents the 26 patients included in the study, and ‘p’ represents the number of mass-cytometry features measured at each of the four timepoints (D0, POD1, POD7, and POD90). A two-dimensional embedding map is generated via t-SNE. An empirical determination of a number (k) of meta-clusters, each containing immune cell features with similar time-dependent trajectories, is achieved using an iterative nearest centroid approach (Fig. S3, Supplemental Digital Content 2, http://links.lww.com/JS9/D510 and methods). After establishing the final meta-clusters, meta-cluster trajectories are extracted by calculating the median value of features within each meta-cluster. B. Center panel. A correlation network illustrates mass cytometry immune cell features and meta-clusters. Each node represents an immune cell feature, for example, the frequency or median signaling activity of a specific immune cell subset. The size of each node corresponds to the P-value of the main effect of POCD calculated from an ANOVA. The edges represent a correlation coefficient (R)>0.7 between two features. Meta-clusters are encircled. Peripheral panels: For each meta-cluster, meta-cluster trajectories are displayed as red/black splines for the POCD and the control groups, respectively, with shaded interquartile ranges. Features are z-scored by subtracting the empirical mean of the feature and dividing it by the empirical SD for each value.
Figure 4
Figure 4
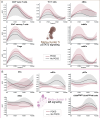
JAK/STAT and MyD88 immune trajectories differentiate patients with and without POCD. A. Immune cell features contained within meta-cluster 5. Median (splines) and interquartile range (shaded area) expression of the basal pSTAT3 signal (arcsinh transformed) in CD4+ naïve T cells, CD4+ memory T cells, regulatory T cells (Tregs), type 1 T helper (Th1) cells, cMCs, ncMCs, intMCs at D0, POD1, POD7, and POD90 in the POCD (red) and control (black) groups. B. Immune cell features contained within meta-cluster 6. Median (splines) and interquartile range (shaded area) expression of the basal pIκB in DCs, cMCs, pDCs, mDCs, and CD56brightCD16neg NK cells, in the POCD (red) and control (black) groups.
Figure 5
Figure 5
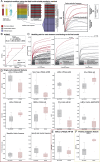
Multivariable modeling of preoperative single-cell and plasma proteomic and clinical datasets with data-driven selection of predictive biomarkers of POCD. A. Analytical workflow using the Stabl multivariable predictive modeling method (see methods). Model features are objectively selected using an artificial noise-injection technique allowing for data-driven estimation of a reliability threshold (theta) that controls the false discovery rate of feature selection. B. Predictive performance of the Stabl multivariable model for identifying patients who will develop POCD at POD7 (AUC=0.80 [0.54–0.9], P=2×10⁻² U-test, Monte Carlo cross-validation on a subset of 22 fully characterized subjects). C. Stability path showing data-driven feature selection for each dataset in the final model (from left to right: mass cytometry, plasma proteomics, and clinical data). The horizontal dashed lines represent the reliability threshold, θ, specific to each dataset. The final model contains one plasma proteomic and 10 single-cell mass cytometry features. D. Barplots depicting the median and interquartile range of the single-cell mass cytometry features selected by the Stabl model and E. the median and interquartile range of NF-κB expression in mDCs, concomitant with the increase in IκB expression described in (A). F. Barplots depicting the median and interquartile range of the proteomic feature selected by the Stabl model. LPSCpG, blood sample stimulated with LPS and CpG; Tregs, regulatory T cells; unstim, unstimulated blood sample.

Update of

References

    1. Meara JG, Leather AJM, Hagander L, et al. . Global surgery 2030: evidence and solutions for achieving health, welfare, and economic development. The Lancet 2015;386:569–624. - PubMed
    1. Sloan M, Premkumar A, Sheth NP. Projected volume of primary total joint arthroplasty in the U.S., 2014 to 2030. J Bone Joint Surg Am 2018;100:1455–1460. - PubMed
    1. Yang T, Velagapudi R, Terrando N. Neuroinflammation after surgery: from mechanisms to therapeutic targets. Nat Immunol 2020;21:1319–1326. - PMC - PubMed
    1. Monk TG, Weldon BC, Garvan CW, et al. . Predictors of cognitive dysfunction after major noncardiac surgery. Anesthesiology 2008;108:18–30. - PubMed
    1. Moller JT, Cluitmans P, Rasmussen LS, et al. . Long-term postoperative cognitive dysfunction in the elderly: ISPOCD1 study. The Lancet 1998;351:857–861. - PubMed

LinkOut - more resources