. 2024 Oct 16:12:RP92201.
doi: 10.7554/eLife.92201.

A Plasmodium falciparum MORC protein complex modulates epigenetic control of gene expression through interaction with heterochromatin

Affiliations

A Plasmodium falciparum MORC protein complex modulates epigenetic control of gene expression through interaction with heterochromatin

Maneesh Kumar Singh et al. Elife. .

Abstract

Dynamic control of gene expression is critical for blood stage development of malaria parasites. Here, we used multi-omic analyses to investigate transcriptional regulation by the chromatin-associated microrchidia protein, MORC, during asexual blood stage development of the human malaria parasite Plasmodium falciparum. We show that PfMORC (PF3D7_1468100) interacts with a suite of nuclear proteins, including APETALA2 (ApiAP2) transcription factors (PfAP2-G5, PfAP2-O5, PfAP2-I, PF3D7_0420300, PF3D7_0613800, PF3D7_1107800, and PF3D7_1239200), a DNA helicase DS60 (PF3D7_1227100), and other chromatin remodelers (PfCHD1 and PfEELM2). Transcriptomic analysis of PfMORCHA-glmS knockdown parasites revealed 163 differentially expressed genes belonging to hypervariable multigene families, along with upregulation of genes mostly involved in host cell invasion. In vivo genome-wide chromatin occupancy analysis during both trophozoite and schizont stages of development demonstrates that PfMORC is recruited to repressed, multigene families, including the var genes in subtelomeric chromosomal regions. Collectively, we find that PfMORC is found in chromatin complexes that play a role in the epigenetic control of asexual blood stage transcriptional regulation and chromatin organization.

Keywords: P. falciparum; PfMORC; Plasmodium falciparum; infectious disease; malaria; microbiology.


Conflict of interest statement

MS, VB, IT, VS, MM, JA, CD, GP, ML, CG No competing interests declared

Figures

Figure 1.
Figure 1.. Proteomic analysis of parasites expressing PfMORCGFP reveals PfMORC association with nuclear proteins of epigenetic regulation.
(A) Volcano plot illustrates the protein enrichment in label free LC-MS/MS analysis of PfMORC CoIPed proteins from three independent experiments at 32 hours post invasion (hpi). For normalized MS/MS counts, Student’s t-test was performed and proteins were ranked as -log2 fold-change (x-axis) versus statistical p-values (y-axis). Gray dashed horizontal line shows the p-value cutoff. (B) Comparative analysis showing the juxtaposition of specific proteins CoIPed in PfMORCGFP with selected proteins from recent works of Hillier et al., Bryant et al., and Subudhi et al., where ApiAP2 or ISW1 were used as bait in similar CoIP experiments. The Venn diagram illustrates the overlap between identified proteins, revealing that the intersecting proteins are primarily ApiAP2 and chromatin remodelers. (C) An interactive protein–protein interaction network is constructed with proteins known to interact with PfMORC, using proteins identified in this study and proteins documented in previously published works. Proteins identified in this study with known interaction networks from the STRING database were used to curate the network employing Cytoscape to enrich the network quality.
Figure 1—figure supplement 1.
Figure 1—figure supplement 1.. Proteomic analysis of PfMORC interacting proteins identified in Plasmodium falciparum lysate.
(A) Coomassie-stained 6% SDS‒PAGE gel showing the parasite lysate of wild-type 3D7 and PfMORCGFP after coimmunoprecipitation with anti-GFP magnetic beads. Both lanes were used for mass spectrometry analysis. (B) Histogram shows the total proteins identified in mass spectrometry analysis from three biological replicates in wild-type 3D7 and PfMORCGFP coimmunoprecipitated samples. Venn diagram illustrates the labeled free LC-MS/MS enrichment of peptide hits obtained from (C) 3D7 control and (D) from PfMORCGFP parasites lysate. Briefly, 32 hpi (±4 hr) trophozoite stage parasites were harvested and lysed, followed by incubation with anti-GFP-Trap-A beads from three independent biological replicates were used for quantification. False discovery rate (FDR) of 1% and peptides ≥2 leads to identifying 191, 814, 589, and 211, 617, 656 significant proteins in 3D7 and PfMORCGFP, respectively. (E) MS/MS normalization of identified proteins from 3D7 parasites expressing PfMORC and transgenic parasites expressing GFP (PfMORCGFP) was carried out. Gene Ontology classification showing biological process, cellular component, and molecular function of PfMORCGFP/3D7 normalized proteins showing fold change ≥1.5.
Figure 2.
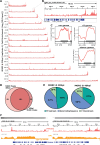
Figure 2.. Genome-wide occupancy of PfMORC reveals localization to hypervariable surface antigen genes at 30 hr and 40 hr.
(A) Coverage tracks of PfMORC across all 14 P. falciparum chromosomes. Plotted values are fold enrichment (Log2[IP/Input]) of a representative replicate at 30 hr. (B) Zoom-in of the last 100 kb region of chromosome two from (A). Gene annotations represented in blue bars (P. falciparum 3D7 strain, version 3, release 57; PlasmoDB.org). (C) Mean fold enrichment of PfMORC occupancy across all var genes (top left), all rif genes (top right), and all stevor genes (bottom right), excluding pseudogenes. Graphical representation of exons to scale for each gene family annotated below enrichment plot in grey (e1 = exon one; e2 = exon two). (D) Quantitative Venn diagram comparing the number of MACS2 called peaks across each timepoint (light pink for 30 hr; dark pink for 40 hr). (E) Pie charts showing the type of genomic locations PfMORC peaks overlap at both 30 hr and 40 hr. Pink slices are 5` regions upstream of the ATG start site of genes, blue slices are coding sequences/gene bodies of genes, and green slices are 3` regions downstream of the stop codon of genes. (F) Zoom-in of the first 100 kb region (left) and the last 100 kb region (right) of chromosome two. Plotted are the ChIP-seq fold enrichment of PfMORC (top track; pink) and heterochromatin protein 1 (HP1; middle track; orange) with gene annotations (bottom track; blue bars; P. falciparum 3D7 strain, version 3, release 57; PlasmoDB.org).
Figure 2—figure supplement 1.
Figure 2—figure supplement 1.. Comparision of ChiP-seq enriched peaks across different PfMORC samples.
(A) Correlation plot (DeepTools PlotCorrelation) of the 30 hr samples compared to the negative control ChIP-seq sample. (B) Correlation plot (DeepTools PlotCorrelation) of the 40 hr samples compared to the negative control ChIP-seq sample. (C) Violin plot showing the ChIP-seq fold enrichment values of significantly called peaks in all six biological replicates. The two GFP samples were only used as additional controls for comparison purposes. (D) Venn diagram comparing the overlap of MACS2-called peaks between anti-HA biological replicates at 30 hr. (E) Venn diagram comparing the overlap of MACS2-called peaks between anti-HA biological replicates at 40 hr. (F) Venn diagram comparing the overlap of MACS2-called peaks between anti-GFP biological replicates at 40 hr.
Figure 2—figure supplement 2.
Figure 2—figure supplement 2.. ChIP-seq profiling of PfMORC fold enrichment across var gene regions.
(Top) Profile plot of the mean PfMORC ChIP-seq fold enrichment (Log2[IP/Input]) for all four samples across all PfEMP1 (var) gene 5` upstream regions and gene bodies. (Bottom) Heatmap of the PfMORC ChIP-seq fold enrichment (Log2[IP/Input]) for all four samples across all PfEMP1 (var) gene 5` upstream regions and gene bodies. (Inset to the right) Zoom-in on the average enrichment of PfMORC at var genes with annotated exons.
Figure 2—figure supplement 3.
Figure 2—figure supplement 3.. ChIP-seq profiling of PfMORC fold enrichment across rif gene regions.
(Top) Profile plot of the mean PfMORC ChIP-seq fold enrichment (Log2[IP/Input]) for all four samples across all rif gene 5` upstream regions and gene bodies. (Bottom) Heatmap of the PfMORC ChIP-seq fold enrichment (Log2[IP/Input]) for all four samples across all rif gene 5` upstream regions and gene bodies. (Inset to the right) Zoom-in on the average enrichment of PfMORC at rif genes with annotated exons.
Figure 2—figure supplement 4.
Figure 2—figure supplement 4.. ChIP-seq profiling of PfMORC fold enrichment across stevor gene regions.
(Top) Profile plot of the mean PfMORC ChIP-seq fold enrichment (Log2[IP/Input]) for all four samples across all rif gene 5` upstream regions and gene bodies. (Bottom) Heatmap of the PfMORC ChIP-seq fold enrichment (Log2[IP/Input]) for all four samples across all rif gene 5` upstream regions and gene bodies. (Inset to the right) Zoom-in on the average enrichment of PfMORC at rif genes with annotated exons.
Figure 2—figure supplement 5.
Figure 2—figure supplement 5.. The heatmaps show the transcript abundance (Chappell et al., 2020) of putative PfMORC gene targets at 30 hr (A) and 40 hr (B).
Red signifies high transcript abundance, and green signifies low transcript abundance. Both timepoints are organized into two major clusters (highlighted with the yellow bar and blue bar).
Figure 3.
Figure 3.. Comparision of mean fold enrichment of PfMORC with ApiAP2 transcription factors and othe epigenetic markers at different time points.
(A) Mean fold enrichment (Log2[IP/Input]) of PfMORC, six associated factors (AP2-G5, AP2-O5, AP2-I, PF3D7_1107800, PF3D7_0613800, and PF3D7_1239200), HP1, and a negative no-epitope control across PfMORC binding sites at the 30 hr timepoint. (B) Mean fold enrichment (Log2[IP/Input]) of PfMORC, six associated factors (AP2-G5, AP2-O5, AP2-I, PF3D7_1107800, PF3D7_0613800, and PF3D7_1239200), HP1, and a negative no-epitope control across PfMORC binding sites at the 40 hr timepoint. (C) Mean fold enrichment (Log2[IP/Input]) and heatmap of two H3K36me2 epigenetic mark timepoints across PfMORC binding sites at 30 hr. (D) Mean fold enrichment (Log2[IP/Input]) and heatmap of two H3K36me2 epigenetic mark timepoints across PfMORC binding sites at 40 hr.
Figure 3—figure supplement 1.
Figure 3—figure supplement 1.. Overlap between PfMORC and other ApiAP2 transcription factors binding regions.
(A) Associated with Figure 3A and B. Mean fold enrichment (Log2[IP/Input]) summary plot (top) and full heatmap (bottom) of fold enrichment of PfMORC, six associated ApiAP2 factors (AP2-G5, AP2-O5, AP2-I, PF3D7_1107800, PF3D7_0613800, and PF3D7_1239200), HP1, and a negative no-epitope control across PfMORC binding sites at the 30 hr and 40 hr timepoints. (B) Quantitative Venn diagrams of the binding site overlap between PfMORC and the six associated ApiAP2 factors.
Figure 3—figure supplement 2.
Figure 3—figure supplement 2.. DNA motif analyses from these different categories: (1) unique to 30 hpi ChIP-seq timepoint, (2) 30 hpi ChIP-seq timepoint, (3) overlap of ChIP-seq timepoint, (4) 40 hpi ChIP-seq timepoint, and (5) unique to 30 hpi ChIP-seq timepoint.
The values to the right of each motif contain the enrichment value, number of peaks containing that motif, and percent of the peaks the contain that motif calculated by Meme Suite.
Figure 3—figure supplement 3.
Figure 3—figure supplement 3.. Mean fold enrichment (Log2[IP/Input]) summary plot (top) and full heatmap (bottom) of fold enrichment of 10 selected epigenetic marks (H2A.Z, H3K9ac, H3K4me3, H3K27ac, H3K18ac, H3K9me3, H3K36me2/3, H4K20me3, and H3K4me1) across PfMORC binding sites at the 30 hr and 40 hr timepoints.
Figure 4.
Figure 4.. Transcriptome analysis of PfMORC knockdown revealed differential gene expression.
(A) Volcano plot displaying the differential gene expression in PfMORC-KD compared to the PfMORC-WT phenotype. Tightly synchronized PfMORCHA-glmS parasites (32 hpi ± 3 hr) were split into two populations, one of which was treated with 2.5 mM GlcN to obtain the PfMORC knockdown phenotype and the other was not treated with GlcN to obtain wild-type phenotype. Total RNA-seq was performed, and significant threshold parameters for differentially expressed genes (DEGs) were assigned to a p-value <0.05 and -log2 fold change >1 from three biological replicates. (B) Scatter plot shows upregulated and downregulated DEGs which were further categorized for pathway and functional enrichment analysis using the KEGG database (p-adjusted value<0.05). The circle size at the vertical axis represents the number of genes in the enriched pathways and the horizontal axis represents gene richness as a ratio of DEGs in the pathways to the total genes in a specific pathway. (C) The violin plot of log2 fold change of genes belonging to the multigene family is constructed from PfMORC-KD vs. PfMORC-WT, which shows DEGs of multigene family proteins upon PfMORC knockdown. (D) The bar plot illustrates the upregulated DEGs of apical organelle origin in PfMORC-KD parasites involved in host cell invasion. (E) Venn diagram showing the comparison between genes obtained from ChIP-seq data and DEGs obtained from RNA-seq data. Both 30hpi and 40 hpi timepoints were taken for comparison and showed high overlap with each other but there was no overlap with RNA-seq data.
Figure 4—figure supplement 1.
Figure 4—figure supplement 1.. Comparison of transcriptional changes with melatonin treatment.
(A) Volcano plot showing the differentially expressed genes in PfMORC-KD parasites relative to PfMORC-WT after 100 nM melatonin treatment for 5 hr from three independent experiments. (B) Venn diagram shows intersecting differentially expressed genes (DEGs) from the experiment with KD vs. WT with DEGs obtained from the experiment (KD vs. WT) treated with 100 nM melatonin for 5 hr. Number of DEGs is shown as up- (red) and downregulated (green). The intersecting region shows 282 upregulated and 340 downregulated genes. Heatmap showing significant DEGs based on p-values and log2FC for upregulating (C) and downregulating (D). These genes are taken from 622 intersecting DEGs showing partial changes in expression after melatonin treatment.

Update of

  • doi: 10.1101/2023.09.11.557196
  • doi: 10.7554/eLife.92201.1
  • doi: 10.7554/eLife.92201.2

References

    1. Antunes AV, Shahinas M, Swale C, Farhat DC, Ramakrishnan C, Bruley C, Cannella D, Robert MG, Corrao C, Couté Y, Hehl AB, Bougdour A, Coppens I, Hakimi M-A. In vitro production of cat-restricted Toxoplasma pre-sexual stages. Nature. 2024;625:366–376. doi: 10.1038/s41586-023-06821-y. - DOI - PMC - PubMed
    1. Arastu-Kapur S, Ponder EL, Fonović UP, Yeoh S, Yuan F, Fonović M, Grainger M, Phillips CI, Powers JC, Bogyo M. Identification of proteases that regulate erythrocyte rupture by the malaria parasite Plasmodium falciparum. Nature Chemical Biology. 2008;4:203–213. doi: 10.1038/nchembio.70. - DOI - PubMed
    1. Bailey TL. STREME: accurate and versatile sequence motif discovery. Bioinformatics. 2021;37:2834–2840. doi: 10.1093/bioinformatics/btab203. - DOI - PMC - PubMed
    1. Balaji S, Babu MM, Iyer LM, Aravind L. Discovery of the principal specific transcription factors of Apicomplexa and their implication for the evolution of the AP2-integrase DNA binding domains. Nucleic Acids Research. 2005;33:3994–4006. doi: 10.1093/nar/gki709. - DOI - PMC - PubMed
    1. Bonnell VA, Zhang Y, Brown JAS, Horton J, Josling GA, Chiu TP, Rohs R, Mahony S, Gordân R, Llinás M. DNA Sequence context and the chromatin landscape differentiate sequence-specific transcription factor binding in the human malaria parasite, Plasmodium falciparum. bioRxiv. 2023 doi: 10.1101/2023.03.31.535174. - DOI - PMC - PubMed

MeSH terms

Associated data