. 2024 Dec;76(6):1429-1442.
doi: 10.1007/s43440-024-00665-7. Epub 2024 Oct 16.

Obesity-related drug transporter expression alterations in human liver and kidneys

Affiliations

Obesity-related drug transporter expression alterations in human liver and kidneys

Katarzyna Kosicka-Noworzyń et al. Pharmacol Rep. 2024 Dec.

Abstract

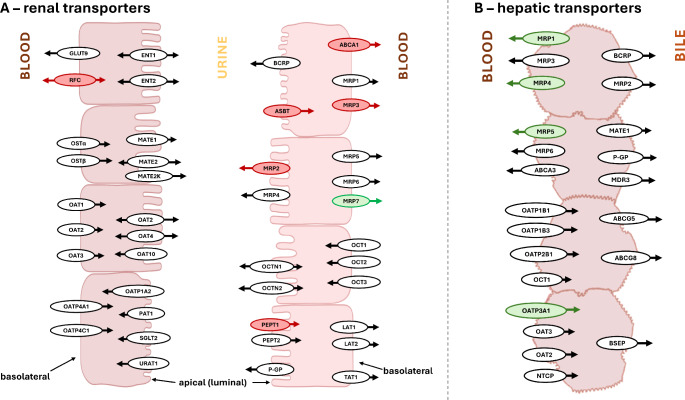
Background: Pathophysiological changes associated with obesity might impact various drug pharmacokinetics (PK) parameters. The liver and kidneys are the primary organs involved in drug clearance, and the function of hepatic and renal transporters is critical to efficient drug elimination (or reabsorption). Considering the impact of an increased BMI on the drug's PK is crucial in directing dosing decisions. Given the critical role of transporters in drug biodisposition, this study investigated how overweight and obesity affect the gene expression of renal and hepatic drug transporters.

Methods: Human liver and kidney samples were collected post-mortem from 32 to 28 individuals, respectively, which were divided into the control group (lean subjects; 18.5 ≤ BMI < 25 kg/m2) and the study group (overweight/obese subjects; BMI ≥ 25 kg/m2). Real-time quantitative PCR was performed for the analysis of 84 drug transporters.

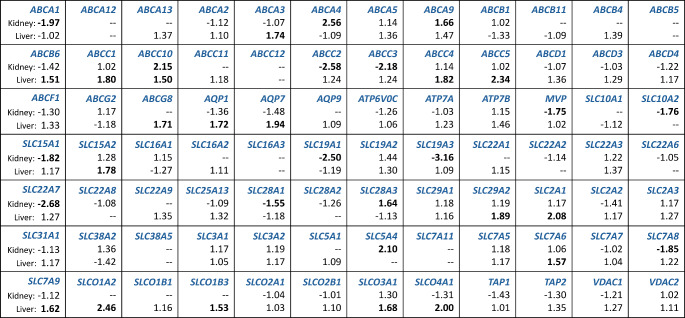
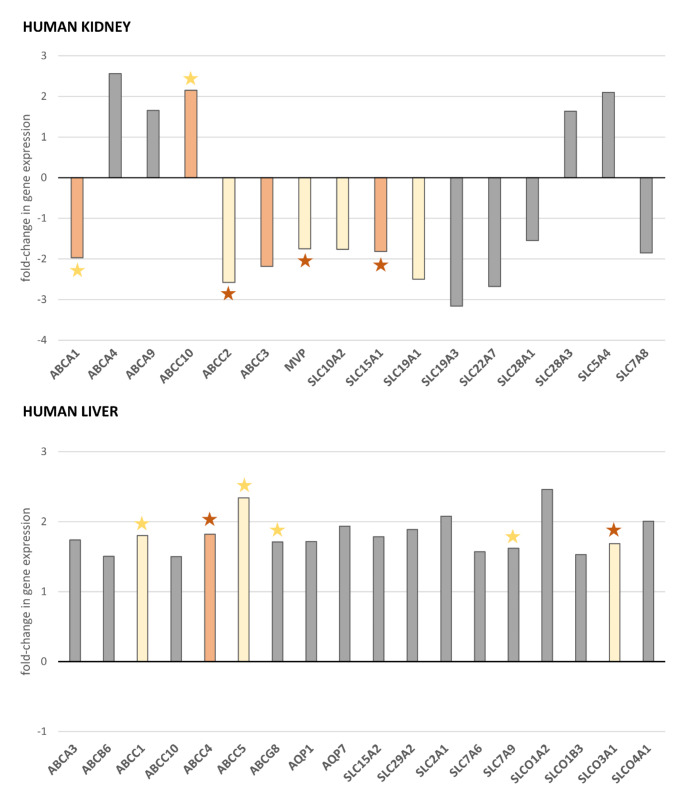
Results: Our results show significant changes in the expression of genes involved in human transporters, both renal and hepatic. In liver tissue, we found that ABCC4 was up-regulated in overweight/obese subjects. In kidney tissue, up-regulation was only observed for ABCC10, while the other differentially expressed genes were down-regulated: ABCA1, ABCC3, and SLC15A1.

Conclusions: The observed alterations may be reflected by the differences in drug PK between lean and obese populations. However, these findings need further evaluation through the proteomic and functional study of these transporters in this patient population.

Keywords: Drug transporters; Hepatic clearance; Obesity; Pharmacokinetics; Renal clearance.


Conflict of interest statement

Declarations. Competing interests: The authors declare no competing interests. Ethics approval: Necropsy specimens of liver and kidney were obtained from the National Disease Research Interchange (Philadelphia, PA, USA). The Rutgers Biomedical Health Sciences Institutional Review Board approved this study as exempt research (Pro2019001020).

Figures

Fig. 1
Fig. 1
Drug transporter genes of which the mRNA expression in human kidneys and liver were evaluated, and the fold-change values. Human kidney and liver samples were collected post-mortem from 28 and 32 individuals (National Disease Research Interchange, Philadelphia, PA, USA), respectively. Patients were divided into the control group (lean subjects; 18.5 ≤ BMI < 25 kg/m2) and the study group (overweight/obese subjects; BMI ≥ 25 kg/m2). Each cell consists of the gene abbreviation marked blue (upper line), the fold-change value for the renal tissue (middle line), and the fold-change value for the liver tissue (lowest line). Fold-change in gene expression between groups was analyzed using qPCR and calculated by dividing the mean [2(−ΔCt)] value in the study group by the respective value for the control group. Results were considered of potential biological relevance if the fold-change was ≥ 1.5 or ≤-1.5; fold-change values above the cut-off are marked in bold
Fig. 2
Fig. 2
Drug transporter genes with potential biologically relevant differences in mRNA expression in the kidneys and liver between overweight/obese (BMI ≥ 25) and lean (18.5 ≤ BMI < 25) populations. Human kidney and liver samples were collected post-mortem from 28 and 32 individuals (National Disease Research Interchange, Philadelphia, PA, USA), respectively, which were divided into the control group (lean subjects; 18.5 ≤ BMI < 25 kg/m2) and the study group (overweight/obese subjects; BMI ≥ 25 kg/m2). Fold-change in gene expression between groups was analyzed using qPCR and calculated by dividing the respective mean [2(−ΔCt)] value for the study group by the value for the control group. Results were considered of potential biological relevance when the fold-change was ≥ 1.5 or ≤-1.5. Genes with a significant change (Student’s t-test or Mann-Whitney U-test; p < 0.05) in expression between groups are marked orange. Yellow color labels genes with a trend towards different expression (Student’s t-test or Mann-Whitney U-test; 0.05 ≤ p < 0.10). Grey color labels delineate results with no statistical significance (p > 0.10). Star indicates a correlation between the log-transformed [2(−ΔCt)] and BMI: orange star labels significant results (Spearman rank test, p < 0.05), yellow star indicates correlations close to significant (0.05 < p < 0.10). Statistics for the indicated differences and trends: KIDNEY (N1 = 13, N2 = 15) – ABCC10 t(d) = 2.366, p = 0.0277; ABCC10 vs. BMI rho = 0.368, p = 0.0538; SLC15A1 t(d)=-2.889, p = 0.0094; SLC15A1 vs. BMI rho=-0.463, p = 0.0131; ABCA1 U = 51.00, p = 0.0325; ABCA1 vs. BMI rho=-0.318, p = 0.0991; ABCC3 U = 53.00, p = 0.0413; SLC10A2 t=-1.765, p = 0.0893; ABCC2 U = 57.00, p = 0.0648; MVP U = 55.00, p = 0.0520; MVP vs. BMI rho=-0.475, p = 0.0106; SLC19A1 U = 59.00, p = 0.0799; SLC19A1 vs. BMI rho=-0.374, p = 0.0497; SLCO3A1 U = 59.00, p = 0.0799; LIVER (N1 = 15, N2 = 17) – ABCC4 U = 68.00, p = 0.0244; ABCC4 vs. BMI rho = 0.383, p = 0.0303; ABCC1 U = 78.00, p = 0.0637; ABCC1 vs. BMI rho = 0.332, p = 0.0633; ABCC5 U = 80.00, p = 0.0757; ABCC5 vs. BMI rho = 0.317, p = 0.0770; SLCO3A1 U = 82.00, p = 0.0894; SLCO3A1 vs. BMI rho = 0.390, p = 0.0275; ABCG8 vs. BMI rho = 0.306, p = 0.0888; SLC7A9 rho = 0.307, p = 0.0872
Fig. 3
Fig. 3
Differentially expressed genes of drug transporters in human kidney and liver. Human kidney and liver samples were collected post-mortem from 28 and 32 individuals (National Disease Research Interchange, Philadelphia, PA, USA), respectively, which were divided into the control group (lean subjects; 18.5 ≤ BMI < 25 kg/m2) and the study group (overweight/obese subjects; BMI ≥ 25 kg/m2). Relative expression was analyzed using qPCR and is shown as log-normalized [2(−ΔCt)] values: A box is drawn from the 1st to 3rd quartile, and a horizontal line is drawn at the median. The upper inner fence is the 3rd quartile + 1.5 × IQR; The lower inner fence is the 1st quartile – 1.5 IQR. The upper whisker is drawn at the highest value (observation, measurement) just below the upper inner fence. The lower whisker is drawn at the highest value (observation, measurement) just above the lower inner fence. The statistical test used for comparison with the respective results is shown in each single graph
Fig. 4
Fig. 4
Localization of (A) renal and (B) hepatic transporters in humans [, –33]. Red color labels transporters, which we found down-regulated (mRNA); green color labels up-regulated transporters. Symbol: ABCAs - subfamily A of ABC transporters, ASBT - apical sodium-dependent bile acid transporter, BCRP - breast cancer resistance protein, BSEP - bile salt export pump, ENTs - equilibrative nucleoside transporters, GLUT9 - facilitative glucose transporter 9, LATs - L-type amino-acid transporters, MATEs - multidrug and toxin extrusions, MRPs - multidrug resistance-associated proteins, NTCP - sodium taurocholate co-transporting polypeptide, OATs - organic anion transporters, OATPs - organic anion-transporting polypeptides, OCTNs - organic cation and carnitine transporters, OCTs - organic cation transporters, OSTs - organic solute transporters, PEPTs - peptide transporters, P-GP - P-glycoprotein (MDR1), RFC - reduced folate transporter, SGLT2 - sodium-glucose co-transporter 2, TAT1 - T-type amino acid transporter 1, URAT1 - urate transporter 1

References

    1. CDC. Obesity is a Common, Serious, and Costly Disease. Centers for Disease Control and Prevention 2022. https://www.cdc.gov/obesity/data/adult.html (accessed November 28, 2023).
    1. World Obesity Federation. World Obesity Atlas 2023. World Obesity Federation 2023. https://www.worldobesity.org/resources/resource-library/world-obesity-at... (accessed November 28, 2023).
    1. Lim Y, Boster J. Obesity and comorbid conditions. StatPearls. Treasure Island (FL): StatPearls Publishing; 2024. - PubMed
    1. Modesto ACF, Silveira EA, dos Santos Rodrigues AP, Lima DM, Provin MP, Amaral RG. Prevalence of Drug Interaction in severely obese individuals and Associated factors: baseline results from a clinical trial. Sci Pharm. 2020;88:48. 10.3390/scipharm88040048.
    1. Gouju J, Legeay S. Pharmacokinetics of obese adults: not only an increase in weight. Biomed Pharmacother. 2023;166:115281. 10.1016/j.biopha.2023.115281. - PubMed

Substances

LinkOut - more resources