Multicenter Study
. 2024 Dec 1;81(12):1253-1264.
doi: 10.1001/jamapsychiatry.2024.3194.

Patterns of Brain Maturation in Autism and Their Molecular Associations

Collaborators, Affiliations
Multicenter Study

Patterns of Brain Maturation in Autism and Their Molecular Associations

Charlotte M Pretzsch et al. JAMA Psychiatry. .

Abstract

Importance: In the neurotypical brain, regions develop in coordinated patterns, providing a fundamental scaffold for brain function and behavior. Whether altered patterns contribute to clinical profiles in neurodevelopmental conditions, including autism, remains unclear.

Objectives: To examine if, in autism, brain regions develop differently in relation to each other and how these differences are associated with molecular/genomic mechanisms and symptomatology.

Design, setting, and participants: This study was an analysis of one the largest deep-phenotyped, case-control, longitudinal (2 assessments separated by approximately 12-24 months) structural magnetic resonance imaging and cognitive-behavioral autism datasets (EU-AIMS Longitudinal European Autism Project [LEAP]; study dates, February 2014-November 2017) and an out-of-sample validation in the Brain Development Imaging Study (BrainMapASD) independent cohort. Analyses were performed during the 2022 to 2023 period. This multicenter study included autistic and neurotypical children, adolescents, and adults. Autistic participants were included if they had an existing autism diagnosis (DSM-IV/International Statistical Classification of Diseases and Related Health Problems, Tenth Revision or DSM-5 criteria). Autistic participants with co-occurring psychiatric conditions (except psychosis/bipolar disorder) and those taking regular medications were included.

Exposures: Neuroanatomy of neurotypical and autistic participants.

Main outcomes and measures: Intraindividual changes in surface area and cortical thickness over time, analyzed via surface-based morphometrics.

Results: A total of 386 individuals in the LEAP cohort (6-31 years at first visit; 214 autistic individuals, mean [SD] age, 17.3 [5.4] years; 154 male [72.0%] and 172 neurotypical individuals, mean [SD] age, 16.35 [5.7] years; 108 male [62.8%]) and 146 individuals in the BrainMapASD cohort (11-18 years at first visit; 49 autistic individuals, mean [SD] age, 14.31 [2.4] years; 42 male [85.7%] and 97 neurotypical individuals, mean [SD] age, 14.10 [2.5] years; 58 male [59.8%]). Maturational between-group differences in cortical thickness and surface area were established that were mostly driven by sensorimotor regions (eg, across features, absolute loadings for early visual cortex ranged from 0.07 to 0.11, whereas absolute loadings for dorsolateral prefrontal cortex ranged from 0.005 to 0.06). Neurodevelopmental differences were transcriptomically enriched for genes expressed in several cell types and during various neurodevelopmental stages, and autism candidate genes (eg, downregulated genes in autism, including those regulating synaptic transmission; enrichment odds ratio =3.7; P =2.6 × -10). A more neurotypical, less autismlike maturational profile was associated with fewer social difficulties and more typical sensory processing (false discovery rate P <.05; Pearson r ≥0.17). Results were replicated in the independently collected BrainMapASD cohort.

Conclusions and relevance: Results of this case-control study suggest that the coordinated development of brain regions was altered in autism, involved a complex interplay of temporally sensitive molecular mechanisms, and may be associated with both lower-order (eg, sensory) and higher-order (eg, social) clinical features of autism. Thus, examining maturational patterns may provide an analytic framework to study the neurobiological origins of clinical profiles in neurodevelopmental/mental health conditions.


Conflict of interest statement

Conflict of Interest Disclosures: Dr Pretzsch reported receiving grants from the National Institute for Health Research and Maudsley Biomedical Research Centre (Early Career Research Award in 2021) outside the submitted work. Dr Charman reported receiving grants from King’s College London and personal fees/royalties from Servier, Hoffmann La Roche, Sage, and Guilford Publications outside the submitted work. Dr Buitelaar reported receiving personal fees from Boehringer Ingelheim, Servier, Medice, Takeda, Angelini, and Neuraxpharm outside the submitted work. No other disclosures were reported.

Figures

Figure 1.
Figure 1.. Schematic Study Overview
A, Identification of differential maturational patterns, including preprocessing of neuroanatomical data (eg, removal of confounding variables through linear regression and down sampling), partial least squares-discriminant analysis to identify patterns, and extraction of loadings and scores. B, Association between differential maturational patterns (loadings) and molecular associations, including transcriptomic decoding and enrichment analyses. C, Association between differential maturational patterns (scores) and cognitive-behavioral variation. Image created with BioRender.com.
Figure 2.
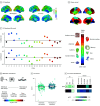
Figure 2.. Spatial Patterns of Developmental Differences in Cortical Thickness and Their Molecular and Cognitive-Behavioral Correlates
A, Partial least squares (PLS) loadings in 360 regions and 44 areas. B, Glasser areas and functional correlates (colors encode Glasser areas 1-22). C, Standardized PLS areal loadings (numbers represent Glasser areas). Interpretation: in areas with positive loadings, neurotypical individuals (vs autistic participants) display a more positive change (smaller decrease/larger increase); in areas with negative loadings, neurotypical individuals (vs autistic participants) display a more negative change (larger decrease/smaller increase) in cortical thickness. D, Molecular associations of spatial patterns along the continuum from more autistic to more neurotypical neuroanatomical development. Text color indicates significance of enrichment. E, PLS scores per group. F, Correlation between PLS scores and behavior. ADI indicates Autism Diagnostic Interview; comm, communication; CSS, Autism Diagnostic Observation Schedule calibrated severity score; LH, left hemisphere; pFDR, false discovery rate-corrected P values; RBS, Repetitive Behaviors Scale; RH, right hemisphere; RRB, Restricted and Repetitive Behaviors Subscale; SA, social affect; social, social domain; SRS, Social Responsiveness Scale; SSP, Short Sensory Profile. aGlasser areas: 1, primary visual cortex (cx); 2, early visual cx; 3, dorsal stream visual cx; 4, ventral stream visual cx; 5, Mt plus; 6, somatosensory motor cx; 7, paracentral lobular and midcingulate cx; 8, premotor cx; 9, posterior opercular cx; 10, early auditory cx; 11, auditory association cx; 12, insular and frontal opercular cx; 13, medial temporal cx; 14, lateral temporal cx; 15, temporo-parieto-occipital junction; 16, superior parietal cx; 17, inferior parietal cx; 18, posterior cingulate cx; 19, anterior cingulate and medial prefrontal cx; 20, orbital and polar frontal cx; 21, inferior frontal cx; 22, dorsolateral prefrontal cx. The Mt plus area covers 9 visual areas in the lateral occipital and posterior temporal cortex.
Figure 3.
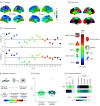
Figure 3.. Spatial Patterns of Developmental Differences in Surface Area and Their Molecular and Cognitive-Behavioral Correlates
A, Partial least squares (PLS) loadings in 360 regions and 44 areas. B, Glasser areas and functional correlates (colors encode Glasser areas 1-22). C, Standardized PLS areal loadings (numbers represent Glasser areas). Interpretation: in areas with positive loadings, neurotypical individuals (vs autistic participants) display a more positive change (smaller decrease/larger increase); in areas with negative loadings, neurotypical individuals (vs autistic participants) display a more negative change (larger decrease/smaller increase) in surface area. D, Molecular associations of spatial patterns along the continuum from more autistic to more neurotypical neuroanatomical development. Text color indicates significance of enrichment. E, PLS scores per group. F, Correlation between PLS scores and behavior. ADI indicates Autism Diagnostic Interview; comm, communication; CSS, Autism Diagnostic Observation Schedule calibrated severity score; LH, left hemisphere; pFDR, false discovery rate-corrected P values; RBS, Repetitive Behaviors Scale; RH, right hemisphere; RRB, Restricted and Repetitive Behaviors Subscale; SA, social affect; social, social domain; SRS, Social Responsiveness Scale; SSP, Short Sensory Profile. aGlasser areas: 1, primary visual cortex (cx); 2, early visual cx; 3, dorsal stream visual cx; 4, ventral stream visual cx; 5, Mt plus; 6, somatosensory motor cx; 7, paracentral lobular and midcingulate cx; 8, premotor cx; 9, posterior opercular cx; 10, early auditory cx; 11, auditory association cx; 12, insular and frontal opercular cx; 13, medial temporal cx; 14, lateral temporal cx; 15, temporo-parieto-occipital junction; 16, superior parietal cx; 17, inferior parietal cx; 18, posterior cingulate cx; 19, anterior cingulate and medial prefrontal cx; 20, orbital and polar frontal cx; 21, inferior frontal cx; 22, dorsolateral prefrontal cx. The Mt plus area covers 9 visual areas in the lateral occipital and posterior temporal cortex.

Comment on

References

    1. Maenner MJ, Shaw KA, Bakian AV, et al. . Prevalence and Characteristics of autism spectrum disorder among children aged 8 years—autism and developmental disabilities monitoring network, 11 sites, US, 2018. MMWR Surveill Summ. 2021;70(11):1-16. doi:10.15585/mmwr.ss7011a1 - DOI - PMC - PubMed
    1. American Psychiatric Association . Diagnostic and Statistical Manual of Mental Disorders. 5th ed. American Psychiatric Association; 2013.
    1. Bieneck V, Bletsch A, Mann C, et al. . Longitudinal changes in cortical thickness in adolescents with autism spectrum disorder and their association with restricted and repetitive behaviors. Genes (Basel). 2021;12(12):2024. doi:10.3390/genes12122024 - DOI - PMC - PubMed
    1. Pretzsch CM, Ecker C. Structural neuroimaging phenotypes and associated molecular and genomic underpinnings in autism: a review. Front Neurosci. 2023;17:1172779. doi:10.3389/fnins.2023.1172779 - DOI - PMC - PubMed
    1. Pretzsch CM, Floris DL, Schäfer T, et al. ; EU-AIMS/AIMS-2-TRIALS Consortium . Cross-sectional and longitudinal neuroanatomical profiles of distinct clinical (adaptive) outcomes in autism. Mol Psychiatry. 2023;28(5):2158-2169. doi:10.1038/s41380-023-02016-z - DOI - PMC - PubMed

MeSH terms