. 2024 Oct;132(10):107004.
doi: 10.1289/EHP14384. Epub 2024 Oct 16.

Lead Acetate Exposure and Cerebral Amyloid Accumulation: Mechanistic Evaluations in APP/PS1 Mice

Affiliations

Lead Acetate Exposure and Cerebral Amyloid Accumulation: Mechanistic Evaluations in APP/PS1 Mice

Huiying Gu et al. Environ Health Perspect. 2024 Oct.

Abstract

Background: The role of environmental factors in Alzheimer's disease (AD) pathogenesis remains elusive. Mounting evidence suggests that acute and past exposure to the environmental toxicant lead (Pb) is associated with longitudinal decline in cognitive function, brain atrophy, and greater brain β-amyloid (Aβ) deposition. However, the nature of Pb-induced amyloid deposition and how it contributes to AD development remain unclear.

Objectives: This study investigates the role of Pb in the pathogenesis of cerebral amyloid angiopathy (CAA) and whether plasminogen activator inhibitor-1 (PAI-1) contributes to this process in the APP/PS1 mouse model.

Methods: Female APP/PS1 mice at 8 wk of age were administered either 50mg/kg Pb-acetate (PbAc) (i.e., 27mg Pb/kg) or an equivalent molar concentration of sodium acetate (NaAc) via oral gavage once daily for 8 wk. Amyloid deposition and vascular amyloid were determined by immunostaining. In addition, Aβ perivascular drainage, vascular binding assay, and microglial endocytosis were examined to determine underlying mechanisms. Furthermore, magnetic resonance imaging demyelination imaging was performed in vivo measure the level of demyelination. Finally, Y-maze and Morris water maze tests were assessed to evaluate the cognitive function of mice.

Results: APP/PS1 mice (an AD mice model) exposed to PbAc demonstrated more vascular amyloid deposition less neocortical myelination, and lower cognitive function, as well as greater vascular binding to Aβ40, higher Aβ40/Aβ42 ratios, strikingly lower Aβ40 levels in the perivascular drainage, and microglial endocytosis. Importantly, exposure to a specific PAI-1 inhibitor, tiplaxtinin, which previously was reported to lower CAA pathology in mice, resulted in less CAA-related outcomes following PbAc exposure.

Discussion: Our findings suggest that PbAc induced CAA/AD pathogenesis via the PAI-1 signaling in the APP/PS1 mouse model, and the inhibition of PAI-1 could be a potential therapeutic target for PbAc-mediated CAA/AD disorders. https://doi.org/10.1289/EHP14384.


Figures
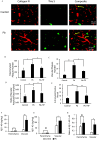
Figure 1A is a stained tissue displays three columns, namely, Collagen 4, Thioflavin S, and Composite, and two columns, namely, Control and Lead with 50 micrometers. Figures 1B to 1E is a bar graphs, plotting total amyloid plaque number, ranging from 0 to 600 in increments of 200; Vascular plaque number, ranging from 0 to 40 in increments of 10; ratio of vascular amyloid or total amyloid, ranging from 0.00 to 0.08 in increments of 0.02; and number of amyloid positive vessels, ranging from 0 to 25 in increments of 5 (y-axis) across control, lead, and lead plus tiplaxtinin (x-axis).Figure 1F to 1H are bar graphs, plotting beta amyloid 1 to 40 (nanogram per milligram), ranging from 0 to 80 in increments of 20; beta amyloid 1 to 42 (nanogram per milligram), ranging from 0 to 150 in increments of 50; and Ratio of beta amyloid 1 to 40 or 1 to 42 (y-axis) across parenchyma and vascular (x-axis) for control and lead.
Figure 1.
Cortical and hippocampal Aβ pathology in 16-wk-old female APP/PS1 mice exposed to PbAc for 8 wk in the presence or absence of TIP. (A) Representative brain sections from APP/PS1 mouse showing expression of collagen IV (red) and amyloid deposits (Thio S+; green). Orange: overlay of the red and green signals. Arrowheads indicate vascular associated amyloid. [Scale bars in (A), 50μm.] (B,C) Quantification of total amyloid plaques and vascular associated amyloid in brain sections of 16-wk-old APP/PS1 mice treated with PbAc, NaAc, or PbAc +TIP. (D) The ratio of vascular Aβ deposits to parenchymal amyloid deposits in brain sections of 16-wk-old APP/PS1 mice treated with PbAc, NaAc, or PbAc +TIP. (E) Quantification of amyloid associated vessels in brain sections of 16-wk-old APP/PS1 mice treated with PbAc. NaAc, or PbAc +TIP. (F,G) Quantification of parenchymal and vascular levels of Aβ40 and Aβ42 in the cortex of 14-wk-old female APP/PS1 mice by ELISA. (H) The ratio of Aβ40 to Aβ42 in both cortical parenchyma and vasculature in 16-wk-old female APP/PS1 mice exposed to Pb for 8 wk. n=34 mice per group. Data are presented as mean±SD. Note: Aβ, beta amyloid; ANOVA, analysis of variance; APP, amyloid precursor protein; CAA, cerebral amyloid angiopathy; NaAc (control), sodium acetate; NS, not significant, analyzed by a one-way ANOVA with post hoc comparisons using Dunnett’s test; Pb, lead; PbAc, lead acetate; PS1, presenilin 1; SD, standard deviation; Thio S, thioflavin S; TIP, tiplaxtinin. *p<0.05, **p<0.01.
Figures 2A and 2D are bar graphs titled spontaneous alternation and probe, plotting spontaneous alternation (percentage), ranging from 0 to 100 in increments of 20 and percent time in target quadrant, ranging from 0 to 60 in increments of 10 (y-axis) across wild type and wild type plus lead (x-axis), respectively. Figures 2B and 2C are clustered bar graphs titled visible and invisible, plotting Latency (seconds), ranging from 0 to 6 in unit increments and 0 to 15 in increments of 5 (y-axis) across day 4, day 5, and day 6 (x-axis) for wild type and wild type plus, respectively.
Figure 2.
Cognitive assessments in WT mice exposed to PbAc. (A) Mice memory in WT female mice exposed to NaAc or PbAc were assessed using the Y-maze spontaneous alternation test. (B–D) The cognitive assessments of mice were also performed using the Morris water maze. After 7-wk NaAc or PbAc exposure, WT mice were subjected to the Morris water maze test. (B) Time interval between the start of the test and the learning to reach the platform (latency) for a visible platform test in WT mice. (C) The latency for a hidden (invisible) platform test in WT mice. (D) The percentage time spent searching in the quadrant previously containing the platform in a probe test of WT mice. Data represent mean±SD. n=6/group. Note: ANOVA, analysis of variance; NaAc, sodium acetate; NS, not significant, analyzed by a one-way ANOVA with post hoc comparisons using Dunnett’s test; Pb, lead; PbAc, lead acetate; SD, standard deviation; WT, wild-type.
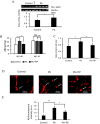
Figure 3A is a set of one western blot and one bar graph. The western blot displays control and lead across the top as columns and plasminogen activator inhibitor-1 45 kilodalton and glyceraldehyde 3-phosphate dehydrogenase 36 kilodalton across the left as rows. The bar graph, plotting ratio of plasminogen activator inhibitor-1 or glyceraldehyde 3-phosphate dehydrogenase, ranging from 0 to 2 in increments of 0.5 (y-axis) across control and lead (x-axis). Figure 3B is a clustered bar graph, plotting beta amyloid (nanogram or milligram), ranging from 0 to 40 in increments of 10 (y-axis) across beta amyloid 1 to 40 and beta amyloid 1 to 42 (x-axis) for control, lead, and lead plus tiplaxtinin. Figure 3C is a bar graph, plotting ratio of beta amyloid 1 to 40 or 1 to 42 (y-axis) across control, lead, and lead plus tiplaxtinin (x-axis). Figure 3D is a stained tissue displays three columns, namely, control, lead, and lead plus tiplaxtinin with 50 micrometers. Figure 3E is a bar graph, plotting beta amyloid fluorescence intensity (arbitrary units), ranging from 0 to 25 in increments of 5 (y-axis) across control, lead, and lead plus tiplaxtinin (x-axis).
Figure 3.
Levels of PAI-1 in cerebral vasculatures, Aβ bound to the cerebrovasculature, and the perivascular drainage of Aβ following PbAc exposures in the presence or absence of TIP. (A) After 3 d treatments with 27mg/kg PbAc or NaAc in female APP/PS1 mice, cortical blood vessels were isolated and vascular levels of PAI-1 were determined by western blot. Levels of PAI-1 and intensities were quantified and normalized by GAPDH levels (n=4/group). (B,C) The cerebrovasculature was isolated from wildtype mice and were pretreated with or without 10μM TIP for 1 h followed by 1μM PbAc treatments for additional 24 h. Next, 1μM Aβ40 or Aβ42 was added to the buffer for 30 min and levels of Aβ bound with vessels were determined by ELISA. (n=4/group). (D) Perivascular drainage was determined by quantitating levels of FITC-labeled Aβ40 associated with arteries between the injection site and 100-μm posterior to the injection site 60 min after injection of FITC-Aβ40. Representative brain sections from APP/PS1 mouse showed Aβ (green) associated with collagen IV (red) labeled vasculatures. Arrowheads indicate vascular associated Aβ (orange: overlay of the red and green signals). (E) Vascular-associated Aβ fluorescent intensity was measured in mice exposed to Pb in the presence or absence of TIP and control mice exposed to Na to examine the perivascular drainage. (n=3/group). Data are presented as mean±SD. Note: Aβ, beta amyloid; ANOVA, analysis of variance; ELISA, enzyme-linked immunosorbent assay; FITC, fluorescein isothiocyanate; GAPDH, glyceraldehyde 3-phosphate dehydrogenase; NaAc (control), sodium acetate; NS, not significant, analyzed by a one-way ANOVA with post hoc comparisons using Dunnett’s test; PAI-1, plasminogen activator inhibitor-1; Pb, lead; PbAc, lead acetate; SD, standard deviation; TIP, tiplaxtinin. *p<0.05, **p<0.01.
Figure 4A is a set of one western blot and one bar graph. The western blot displays control and lead across the top as columns and plasminogen activator inhibitor-1 45 kilodalton and glyceraldehyde 3-phosphate dehydrogenase 36 kilodalton across the left as rows. The bar graph, plotting ratio of plasminogen activator inhibitor-1 or glyceraldehyde 3-phosphate dehydrogenase, ranging from 0.0 to 2.0 in increments of 0.2 (y-axis) across control and lead (x-axis). Figure 4B is a clustered bar graph, plotting beta amyloid (nanogram per milligram), ranging from 0 to 80 in increments of 20 (y-axis) across beta amyloid 1 to 40 and beta amyloid 1 to 42 (x-axis) for control, lead, and lead plus tiplaxtinin. Figure 4C is a bar graph, plotting ratio of beta amyloid 1 to 40 or 1 to 42 (y-axis) across control, lead, and lead plus tiplaxtinin (x-axis). Figure 4D is a set of one western blot and one bar graph. The western blot displays control and lead across the top as columns and low-density lipoprotein receptor-related protein 1 85 kilodalton and glyceraldehyde 3-phosphate dehydrogenase 36 kilodalton across the left as rows. The bar graph, plotting ratio of low-density lipoprotein receptor-related protein 1 or glyceraldehyde 3-phosphate dehydrogenase, ranging from 0 to 1.6 in increments of 0.4 (y-axis) across control and lead (x-axis).
Figure 4.
PAI-1 and LRP-1 expression and intracellular levels of Aβ40 and Aβ42 in cultured BV2 cells exposed to PbAc or NaAc in the presence of TIP. (A) Expression levels of PAI-1 in BV2 cells exposed to 1μM PbAc for 24 h were determined by western blot. (B,C) Intracellular levels of Aβ40 and Aβ42 and the ratio of Aβ40 to Aβ42 in BV2 exposed to 1μM PbAc for 24 h in the presence and absence of TIP. (D) Expression levels of LRP1 in BV2 cells exposed to 1μM PbAc for 24 h were determined by western blot. Data are presented as mean±SD, n=6/group. Note: Aβ, beta amyloid; ANOVA, analysis of variance; LRP1, low-density lipoprotein receptor-related protein 1; NaAc (control), sodium acetate; NS, not significant, analyzed by a one-way ANOVA with post hoc comparisons using Dunnett’s test; PAI-1, plasminogen activator inhibitor-1; Pb, lead; PbAc, lead acetate; SD, standard deviation; TIP, tiplaxtinin. *p<0.05.
Figure 5A is a stained tissue with three columns, namely, neuronal nuclei, 4′,6-diamidino-2-phenylindole, and composite, and two rows, namely, control and lead. Figure 5B is a bar graph, plotting number of neuronal nuclei positive cells, ranging from 0 to 50 in increments of 10 (y-axis) across control and lead (x-axis). Figure 5C is a set of four stained tissues, depicting areas of female mice exposed to control hippocampus, control cortex, lead hippocampus, and lead cortex. Figures 5D and 5E are bar graphs titled hippocampus and cortex, plotting myelin basic protein fluoresence internsity (arbitrary units), ranging from 0 to 40 in increments of 10 and 0 to 50 in increments of 10 (y-axis) across control, lead, lead plus tiplaxtinin (x-axis), respectively.
Figure 5.
Myelin expression and neuronal cell numbers in 8-wk PbAc-treated APP/PS1 mice. (A) Representative 20× images of NeuN+DAPI+ staining in the neocortex. (B) Quantitation of NeuN+DAPI+ cells in hippocampal and cortical areas of female APP/PS1 mice exposed to NaAc or PbAc (n=3/group, p>0.05). (C) Representative 20× images of MBP staining in hippocampal and cortical areas of female APP/PS1 mice exposed to NaAc or PbAc. (D,E) MBP expression in hippocampal (D) and cortical areas (E) of female APP/PS1 mice exposed to NaAc or PbAc in the presence or absence of TIP were measured by quantitating MBP fluorescent intensities; data are presented as mean±SD, n=3/group. Note: ANOVA, analysis of variance; APP, amyloid precursor protein; CTX, cortex; DAPI, 4′,6-diamidino-2-phenylindole; HPC, hippocampus; NaAc, sodium acetate; NeuN, neuronal nuclei; NS, not significant, analyzed by a one-way ANOVA with post hoc comparisons using Dunnett’s test; Pb, lead; PbAc, lead acetate; PS1, presenilin 1; SD, standard deviation; TIP, tiplaxtinin. *p<0.05.
Figure 6A is a Magnetic Resonance Imaging of myelin in amyloid precursor protein or presenilin 1 mice exposed to lead and lead plus tiplaxtinin. A scale ranges from 0.00 to 0.36 in increments of 0.36. Figure 6B is a bar graph, plotting Myelin water fraction, ranging from 0.1 to 0.4 in increments of 0.1 (y-axis) across white matter and gray matter (x-axis) for lead and lead plus tiplaxtinin.
Figure 6.
MRI imaging of myelin in APP/PS1 mice exposed to PbAc in the presence or absence of tiplaxtinin. Direct myelin imaging with UTE time: (A) Representative myelin/water fraction image. (B) Cortex mean myelin/water fraction in neocortex areas detected by MRI Data represent mean±SD, n=34/group. Note: APP, amyloid precursor protein; MRI, magnetic resonance imaging; NS, not significant, analyzed by a two-sample Student’s t-test; Pb, lead; PS1, presenilin 1; SD, standard deviation; TIP, tiplaxtinin; UTE, ultra-short echo. **p<0.01.
Figures 7A and 7D are bar graphs titled spontaneous atternation and probe, plotting spontaneous alternation performance (percentage), ranging from 0 to 100 in increments of 20 and percentage of time target quadrant, ranging from 0 to 60 in increments of 20 (y-axis) across control, control plus tiplaxtinin, lead, and lead plus tiplaxtinin (x-axis), respectively. Figures 7B and 7C are clustered bar graph titled visible and invisible, plotting latency (second), ranging from 0 to 60 in increments of 20 and 0 to 80 in increments of 20 (y-axis) across day 4, day 5, and day 6 (x-axis) for control, control plus tiplaxtinin, lead, and lead plus tiplaxtinin, respectively.
Figure 7.
Cognitive assessments in APP/PS1 mice exposed to PbAc in the presence or absence of TIP. (A) Mice memory in APP/PS1 mice exposed to NaAc or PbAc in the presence or absence of TIP was assessed using the Y-maze spontaneous alternation test. (B–D) The cognitive assessments of mice were also performed using the Morris water maze. After 7-wk NaAc or PbAc exposure in the presence or absence of TIP, APP/PS1 mice were subjected to the Morris water maze test. (B) Time interval between the start of the test and learning to reach the platform (latency) for a visible platform test in APP/PS1 mice. (C) The latency for a hidden (invisible) platform test in APP/PS1 mice. (D) The percentage time spent searching in the quadrant previously containing the platform in a probe test of APP/PS1 mice. Data represent mean±SD. Control: n=9, Control+TIP: n=5, Pb: n=11, Pb+TIP: n=9. Note: ANOVA, analysis of variance; APP, amyloid precursor protein; NaAc (control), sodium acetate; NS, not significant, analyzed by a one-way ANOVA with post hoc comparisons using Dunnett’s test; Pb, lead; PbAc, lead acetate; PS1, presenilin 1; SAP, spontaneous alternation performance; SD, standard deviation; TIP, tiplaxtinin. *p<0.05, **p<0.01.

References

    1. Zheng W, Aschner M, Ghersi-Egea JF. 2003. Brain barrier systems: a new frontier in metal neurotoxicological research. Toxicol Appl Pharmacol 192(1):1–11, PMID: 14554098, 10.1016/s0041-008x(03)00251-5. - DOI - PMC - PubMed
    1. Haraguchi T, Ishizu H, Takehisa Y, Kawai K, Yokota O, Terada S, et al. . 2001. Lead content of brain tissue in diffuse neurofibrillary tangles with calcification (DNTC): the possibility of lead neurotoxicity. Neuroreport 12(18):3887–3890, PMID: 11742204, 10.1097/00001756-200112210-00006. - DOI - PubMed
    1. Graves AB, van Duijn CM, Chandra V, Fratiglioni L, Heyman A, Jorm AF, et al. . 1991. Occupational exposures to solvents and lead as risk factors for Alzheimer’s disease: a collaborative re-analysis of case–control studies. EURODEM Risk Factors Research Group. Int J Epidemiol 20 Suppl 2:S58–S61, PMID: 1833355, 10.1093/ije/20.supplement_2.s58. - DOI - PubMed
    1. Szabo ST, Harry GJ, Hayden KM, Szabo DT, Birnbaum L. 2016. Comparison of metal levels between postmortem brain and ventricular fluid in Alzheimer’s disease and nondemented elderly controls. Toxicol Sci 150(2):292–300, PMID: 26721301, 10.1093/toxsci/kfv325. - DOI - PMC - PubMed
    1. Brown EE, Shah P, Pollock BG, Gerretsen P, Graff-Guerrero A. 2019. Lead (Pb) in Alzheimer’s dementia: a systematic review of human case–control studies. Curr Alzheimer Res 16(4):353–361, PMID: 30854970, 10.2174/1567205016666190311101445. - DOI - PubMed

LinkOut - more resources