. 2025 Jan 2;85(1):154-170.
doi: 10.1158/0008-5472.CAN-23-3603.

Replication Stress Is an Actionable Genetic Vulnerability in Desmoplastic Small Round Cell Tumors

Affiliations

Replication Stress Is an Actionable Genetic Vulnerability in Desmoplastic Small Round Cell Tumors

Asuka Kawai-Kawachi et al. Cancer Res. .

Abstract

Desmoplastic small round cell tumor (DSRCT) is an aggressive sarcoma subtype that is driven by the EWS-WT1 chimeric transcription factor. The prognosis for DSRCT is poor, and major advances in treating DSRCT have not occurred for over two decades. To identify effective therapeutic approaches to target DSRCT, we conducted a high-throughput drug sensitivity screen in a DSRCT cell line assessing chemosensitivity profiles for 79 small-molecule inhibitors. DSRCT cells were sensitive to PARP inhibitors (PARPi) and ataxia-telangiectasia and Rad3-related inhibitors (ATRi), as monotherapies and in combination. These effects were recapitulated using multiple clinical PARPi and ATRi in three biologically distinct, clinically relevant models of DSRCT, including cell lines, a patient-derived xenograft-derived organoid model, and a cell line-derived xenograft mouse model. Mechanistically, exposure to a combination of PARPi and ATRi caused increased DNA damage, G2-M checkpoint activation, micronuclei accumulation, replication stress, and R-loop formation. EWS-WT1 silencing abrogated these phenotypes and was epistatic with exogenous expression of the R-loop resolution enzyme RNase H1 in reversing sensitivity to PARPi and ATRi monotherapies. The combination of PARPi and ATRi also induced EWS-WT1-dependent cell-autonomous activation of the cyclic GMP-AMP synthase-stimulator of IFN genes innate immune pathway and cell-surface expression of PD-L1. Taken together, these findings point toward a role for EWS-WT1 in generating R-loop-dependent replication stress that leads to a targetable vulnerability, providing a rationale for the clinical assessment of PARPi and ATRi in DSRCT. Significance: EWS-WT1, the unique oncogenic driver of desmoplastic small round cell tumors, confers sensitivity to PARP and ATR inhibitors, supporting the potential of these drugs in treating patients with this aggressive sarcoma subtype.


Conflict of interest statement

M.M. Lenormand reports grants from Institut Pasteur outside the submitted work. N. Herbel reports personal fees from Viroxis and other support from Pharmaceutical Product Development and Thermo Fisher Scientific outside the submitted work. A. Loktev reports grants from The Kelly Turner Foundation during the conduct of the study. A. Zimmermann reports employment by Merck Healthcare KGaA, Darmstadt, Germany, during the conduct of the study. O. Mir reports personal fees from Amgen outside the submitted work. A. Le Cesne reports personal fees from PharmaMar and Deciphera outside the submitted work. M. Faron reports personal fees from Vifor Pharma outside the submitted work. C.J. Lord reports grants and personal fees from AstraZeneca, Merck KGaA, Artios, and NeoPhore; personal fees from FoRx, Syncona, Sun Pharma, Gerson Lehrman Group, Vertex, Third Rock, Ono Pharmaceutical, Abingworth, Tesselate, Dark Blue Therapeutics, Pontifax, Astex, GlaxoSmithKline, Dawn Bioventures, Blacksmith Medicines, and Ariceum; personal fees and other support from Tango Therapeutics; and other support from OVIBIO and Hysplex during the conduct of the study, as well as being a named inventor on patents describing the use of DNA repair inhibitors and stands to gain from their development and use as part of the ICR's “Rewards to Inventors” scheme and also receiving benefits from this scheme associated with patents for PARP inhibitors paid into the author’s personal account and research accounts at the Institute of Cancer Research. S. Postel-Vinay reports research grants from AstraZeneca, Amgen, and Hoffman-La Roche/imCORE outside the submitted work. S. Postel-Vinay is also principal investigator of clinical trials sponsored by Amgen, Daiichi Sankyo, BeiGene, Bristol Myers Squibb, AstraZeneca, Clever Peptide, GlaxoSmithKline, Novartis, Oxford BioTherapeutics, and Roche (institutional funding for running the clinical trial); as well as personal fees from EPICS Therapeutics outside the submitted work. No disclosures were reported by the other authors.

Figures
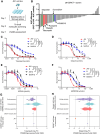
Figure 1.
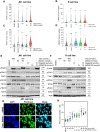
Figure 1.
A small-molecule inhibitor and drug screen identifies PARPi and ATRi as candidate therapies for DSRCT. A, Schematic illustration of the workflow of small-molecule inhibitor and drug screen performed on the JN1 cell line. B, Waterfall plot displaying the difference in AUC between the JN1 cell line (AUCJN1) and the panel of 92 cell lines used for comparison (AUCmedian) for the 79 evaluated small-molecule inhibitors or drugs. Red, PARPi; blue, ATRi; green, conventional cytotoxic. C–F, Dose–response survival curves of the DSRCT cell lines JN1 and R, and the A673 (Ewing sarcoma) and SaOS-2 (osteosarcoma) cell lines exposed to talazoparib (C), olaparib (D), M4344 (E), or AZD6738 (F) for 7 days. Mean ± SD; n = 3. G and H, Violin plots showing the relative sensitivity (log2-fold change of cell viability) of cell lines exposed to the PARPi talazoparib (G) or olaparib (H) after a single-dose exposure at 2.5 μmol/L for 5 days in the DepMap database (PRISM Repurposing 23Q2), in comparison with that of the JN1 and R cell lines. JN1 and R cell line sensitivities were extrapolated from the survival assays presented in C and E; SFs were calculated at 2.5 μmol/L and log2 transformed. Ewing sarcoma cell lines (n = 16): RDES, A673, SKES1, CADOES1, EWS502, MHHES1, EW8, A673STAG2KO16, A673STAG2KO45, A673STAG2NT14, A673STAG2NT23, CBAGPN, CHLA10, SKNEP1, SKPNDW, and TC32; osteosarcoma cell lines (n = 5): G292CLONEA141B1, MG63, U2OS, HOS, and SJSA1; soft-tissue sarcoma cell lines (n = 7): S117, TE617T, HT1080, HS729, RD, RKN, and RH30, including rhabdomyosarcoma (n = 4), leiomyosarcoma (n = 1), fibrosarcoma (n = 1), and NOS sarcoma cell lines (n = 1), respectively. The BRCA1/2-mutant IGROV1 ovarian cancer cell line and BRCA1-mutant MDA-MB-436 breast cancer cell line were used as positive controls for sensitivity to PARPi. **, P < 0.01; ****, P < 0.0001; ns, not significant.
Figure 2.
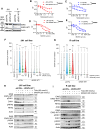
Figure 2.
PARPi and ATRi have synergistic cytotoxic effects in models of DSRCT with high PARP1 expression. A and B, PARP1 expression (A) and PARylation levels (B) as assessed by IHC in a cohort of 16 DSRCT samples, compared with those of the JN1 and R cell lines (PARP1 and PAR expression levels are shown as H-scores). Representative cases (PARP1-high vs. PARP1-low tumors; PAR-high vs. PAR-low tumors) are shown to the right, compared with JN1 and R cells. C and D, Surface plots of Bliss independence scores calculated for the talazoparib–M4344 combination in JN1 (C) and R (D) cell lines at 7 days. E, The GR_13-PDX-O model was established from the primary peritoneal tumor of a patient with DSRCT, with confirmation of EWSR1::WT1 fusion by FISH and WT1-Cter IHC (Supplementary Fig. S8). F, Surface plot of Bliss independence scores calculated for the talazoparib–M4344 combination in the GR_13 PDX-O at 7 days. Mean ± SD; n = 3. Surface plots: the x-axis and y-axis values indicate drug concentrations, and the z-axis values indicate the associated synergy score; score < −10, antagonistic interaction; score = 0, absence of interaction; score > 10, synergistic interaction. G, Schematic illustration of an in vivo therapeutic experiment performed to evaluate the antitumor effect of PARPi talazoparib and ATRi M1774 in NSG mice engrafted with JN1 xenografts. H, Therapeutic responses to drug treatment in mice harboring JN1 xenografts. Mean tumor volume ± SD; two-way ANOVA and post hoc Dunnett test. I, Tumor volume at the time of mice sacrifice. Mean ± SD; one-way ANOVA and post hoc Šídák test. *, P < 0.01; ns, not significant. Tala, talazoparib.
Figure 3.
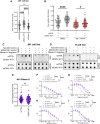
Figure 3.
PARPi and ATRi combination elicits DNA damage, replication stress, and genomic instability in DSRCT cells. A–D, Quantification of γH2AX (A and B) or RAD51 foci (C and D) in JN1 (A and C) or R (B and D) cells exposed to DMSO control, PARPi talazoparib (Tala), ATRi M4344, or a combination of both for 72 hours. Cisplatin was used as the positive control. A minimum of 500 nuclei was analyzed per condition. Violin plots show the absolute number of foci per nucleus. Thick line, median; thin lines, bottom and top quartiles; two-way ANOVA and post hoc Dunn test. E and F, Western blots of pCHK1, CHK1, pRPA2, RPA2, γH2AX, H2AX, and cleaved-PARP1 (cPARP) in JN1 (E) or R (F) cells exposed to DMSO control, PARPi talazoparib or olaparib, ATRi M4344 or AZD6738, or a combination of both for 48 hours. G and H, Representative immunofluorescence images (G) and quantification (H) of micronuclei-positive cells in JN1 cells exposed to DMSO control, PARPi talazoparib, ATRi M4344, or a combination of both for 72 hours. A minimum of 500 cells was analyzed per condition. Mean ± SD; n = 3; one-way ANOVA and post hoc Dunn test. Arrows, micronuclei. Scale bar, 20 μm. *, P < 0.05; **, P < 0.01; ***, P < 0.001; ****, P < 0.0001; ns, not significant.
Figure 4.
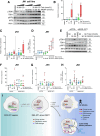
Figure 4.
EWS–WT1 is a determinant of DSRCT cells’ sensitivity to PARPi and ATRi. A, Western blot of EWS–WT1 in JN1 and R cells transfected with either siCNTRL or siEWS–WT1. Whole-cell lysates were generated 48 hours after transfection. B–E, Dose–response survival curves of JN1 or R cells exposed to PARPi talazoparib (B and C) or ATRi M4344 (D and E) for 7 days in the presence or absence of siRNA-mediated silencing of EWS–WT1. Mean ± SD; n = 3. F and G, Quantification of γH2AX in JN1 cells exposed to DMSO control, PARPi talazoparib, ATRi M4344, or a combination of both for 72 hours, in the presence or absence of siRNA-mediated silencing of EWS–WT1. Cisplatin was used as the positive control. A minimum of 500 nuclei was analyzed per condition. Violin plots show the absolute number of foci per nucleus. Thick line, median; thin lines, bottom and top quartiles; two-way ANOVA and post hoc Dunn test. H and I, Western blots of pCHK1, CHK1, pRPA2, RPA2, γH2AX, H2AX, and EWS–WT1 in JN1 (H) or R (I) cells exposed to DMSO control, PARPi talazoparib (Tala), ATRi M4344, or a combination of both for 48 hours, in the presence or absence of siRNA-mediated silencing of EWS–WT1. ****, P < 0.0001; ns, not significant.
Figure 5.
Figure 5.
EWS–WT1 drives enhanced DNA replication stress and R-loops, which contribute to DSRCT cells’ sensitivity to PARPi and ATRi. A, Assessment of replication fork speed (kb/minute) in JN1 cells subjected to siRNA-mediated silencing of EWS–WT1 or CCND1. A minimum of 50 forks was analyzed per condition. Mean ± SD; each dot represents a single replication fork; n = 2, one-way ANOVA and post hoc Dunnett test. B, Assessment of replication fork speed (kb/minute) in JN1 cells exposed to DMSO control, or a combination of PARPi talazoparib (Tala) and ATRi M4344 for 6 hours, in the presence or absence of siRNA-mediated silencing of EWS–WT1. A minimum of 50 forks was analyzed per condition. Mean ± SD; each dot represents a single replication fork; n = 2; two-way ANOVA and post hoc Šídák test. C and D, DNA:RNA hybrid dot blot of genomic DNA extracted from JN1 (C) or R (D) cells exposed to PARPi talazoparib, ATRi M4344, or a combination of both in the presence or absence of siRNA-mediated silencing of EWS–WT1 as in B. S9.6, RNA:DNA hybrids; ssDNA, loading control. E, Assessment of replication fork speed (kb/minute) in RNase H1–overexpressing JN1 cells subjected to siRNA-mediated silencing of EWS–WT1. Synchronized cells were collected 14 hours after transfection. A minimum of 50 forks was analyzed per condition. Mean ± SD; each dot represents a single replication fork; n = 2; unpaired t test. E, Dose–response survival curves of JN1 cells exposed to PARPi talazoparib (F) or olaparib (G), and ATRi M4344 (H) or AZD6738 (I) for 7 days in the presence or absence of siRNA-mediated silencing of EWS–WT1 and/or RNase H1 overexpression. Mean ± SD; n = 3; two-way ANOVA. *, P < 0.05; ****, P < 0.0001; ns, not significant.
Figure 6.
Figure 6.
The combination of PARPi and ATRi elicits a cGAS–STING–mediated cell-autonomous immune response. A, Western blots of pTBK1, TBK, pIRF3, and IRF3 in JN1 cells exposed to DMSO control, PARPi talazoparib (Tala), ATRi M4344, or a combination of both for 72 hours. B and C, RT-qPCR analysis of RNA isolated from JN1 cells exposed to DMSO control, PARPi talazoparib, ATRi M4344, or a combination of both for 72 hours. CCL5 (B) and CXCL10 (C) mRNA were analyzed separately relative to RPLP0. Box and whisker plots show arbitrary units of gene expression, normalized to the DMSO condition. Boxes, median and lower and upper quartiles; whiskers, the 5th to 95th percentile range; n = 4; two-way ANOVA and post hoc Dunnett test, relative to the DMSO condition. D, Quantification of PD-L1 cell-surface expression by flow cytometry in JN1 cells exposed to DMSO control, PARPi talazoparib, ATRi M4344, or a combination of both for 72 hours. Scatter plot shows the percentage of PD-L1–positive cells within the DAPI-negative population, normalized to the DMSO condition. Mean ± SD; n = 3. Kruskal–Wallis test and post hoc Dunnett test, relative to the DMSO condition. E, Western blots of pTBK1, TBK, pIRF3, and IRF3 in JN1 cells exposed to DMSO control, PARPi talazoparib, ATRi M4344, or a combination of both for 72 hours, in the presence or absence of siRNA-mediated silencing of EWS–WT1. Appropriate silencing of EWS–WT1 was verified as shown in Fig. 4H. F and G, RT-qPCR analysis of RNA isolated from JN1 cells exposed to DMSO control, PARPi talazoparib, ATRi M4344, or a combination of both for 72 hours, in the presence or absence of siRNA-mediated silencing of EWS–WT1. CCL5 (F) and CXCL10 (G) mRNA were analyzed separately relative to RPLP0. Box and whisker plots show arbitrary units of gene expression, normalized to the siCNTRL DMSO condition. Boxes, median and lower and upper quartiles; whiskers, the 5th to 95th percentile range; n = 4; two-way ANOVA and post hoc Dunnett test, relative to the siCNTRL DMSO condition. H, Quantification of PD-L1 cell-surface expression by flow cytometry in JN1 cells exposed to DMSO control, PARPi talazoparib, ATRi M4344, or a combination of both for 72 hours, in the presence or absence of siRNA-mediated silencing of EWS–WT1. Scatter plot shows the percentage of PD-L1–positive cells within the DAPI-negative population, normalized to the siCNTRL DMSO condition. Mean ± SD; n = 3. Kruskal–Wallis test and post hoc Dunnett test, relative to the siCNTRL DMSO condition. I, Model of EWS–WT1–driven DSRCT sensitivity to PARPi and ATRi. *, P < 0.05; **, P < 0.01; ***, P < 0.001; ****, P < 0.0001; ns, not significant. ISG, IFN-stimulated genes.

References

    1. Subbiah V, Lamhamedi-Cherradi S-E, Cuglievan B, Menegaz BA, Camacho P, Huh W, et al. . Multimodality treatment of desmoplastic small round cell tumor: chemotherapy and complete cytoreductive surgery improve patient survival. Clin Cancer Res 2018;24:4865–73. - PMC - PubMed
    1. Cidre-Aranaz F, Watson S, Amatruda JF, Nakamura T, Delattre O, de Alava E, et al. . Small round cell sarcomas. Nat Rev Dis Primer 2022;8:66. - PubMed
    1. Mello CA, Campos FAB, Santos TG, Silva MLG, Torrezan GT, Costa FD, et al. . Desmoplastic small round cell tumor: a review of main molecular abnormalities and emerging therapy. Cancers (Basel) 2021;13:498. - PMC - PubMed
    1. Chow WA, Yee J-K, Tsark W, Wu X, Qin H, Guan M, et al. . Recurrent secondary genomic alterations in desmoplastic small round cell tumors. BMC Med Genet 2020;21:101. - PMC - PubMed
    1. Slotkin EK, Bowman AS, Levine MF, Dela Cruz F, Coutinho DF, Sanchez GI, et al. . Comprehensive molecular profiling of desmoplastic small round cell tumor. Mol Cancer Res 2021;19:1146–55. - PMC - PubMed

MeSH terms

Substances