. 2024 Oct 22;43(10):114865.
doi: 10.1016/j.celrep.2024.114865. Epub 2024 Oct 16.

Hepatocyte Period 1 dictates oxidative substrate selection independent of the core circadian clock

Affiliations

Hepatocyte Period 1 dictates oxidative substrate selection independent of the core circadian clock

Jiameng Sun et al. Cell Rep. .

Abstract

Organisms integrate circadian and metabolic signals to optimize substrate selection to survive starvation, yet precisely how this occurs is unclear. Here, we show that hepatocyte Period 1 (Per1) is selectively induced during fasting, and mice lacking hepatocyte Per1 fail to initiate autophagic flux, ketogenesis, and lipid accumulation. Transcriptomic analyses show failed induction of the fasting hepatokine Fgf21 in Per1-deficient mice, and single-nucleus multiome sequencing defines a putative responding hepatocyte subpopulation that fails to induce the chromatin accessibility near the Fgf21 locus. In vivo isotopic tracing and indirect calorimetry demonstrate that hepatocyte Per1-deficient mice fail to transit from oxidation of glucose to fat, which is completely reversible by exogenous FGF21 or by inhibiting pyruvate dehydrogenase. Strikingly, disturbing other core circadian genes does not perturb Per1 induction during fasting. We thus describe Per1 as an important mechanism by which hepatocytes integrate internal circadian rhythm and external nutrition signals to facilitate proper fuel utilization.

Keywords: CP: Metabolism; circadian clock; fasting; glucose oxidation; liver metabolism; metabolite tracing; single-nucleus multiome sequencing.


Conflict of interest statement

Declaration of interests The authors declare no competing interests.

Figures
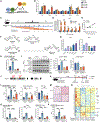
Figure 1.
Figure 1.. Hepatocyte Per1 mediates canonical physiological fasting responses
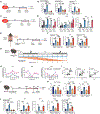
(A) Schematic of the canonical core circadian regulatory network. (B) Relative expression level of circadian genes in liver from mice fasted for 0, 12, 16, or 24 h; n = 3. (C) Schematic of the 24-h time-course harvest of tissues from mice either fed ad libitum or fasted for 16 h. (D) Relative expression level of Per1 (normalized to mice fed ad libitum harvested at the same time) in liver harvested throughout the 24-h time course; n = 3–4. (E) Correlation test result between normalized expression level of Per1 in 16-h-fasted mice in (D) and the corresponding food consumption measured within the same period in the mice fed ad libitum. Dotted line denotes the 95% confidence interval for the simple linear regression calculation. (F) Chair conformations of trehalose (Tre), 6-azido trehalose (6-TreAz), 4-trehalosamine (4-TA), and IMCAT-C14 (IMCTA). (G) Relative expression level of Per1 and Per2 from isolated wild-type primary hepatocytes treated for 24 h with regular growth medium (Control), Tre (100 mM), 6-TreAz (100 mM), 4-TA (100 mM), or IMCTA (100 μM) in complete culture medium; n = 3–6. (H) Relative expression level of Per1 from AML12 cells transduced with Ad-GFP or Ad-shPer1 for 48 h followed by a full medium change to either complete or starvation medium for 6 h; n = 5. (I) Immunoblot analysis of AML12 cells described in (H) with additional treatment of dimethyl sulfoxide (DMSO) or bafilomycin A1 (BafA1) (200 nM) (left) during the medium change, and quantification of LC3A/B-II (right); n = 2. (J) Per1fl/fl mice design at the Per1 locus. (K) Schematic of the 14 h + 2 h fast/refeed experimental design in Per1fl/fl (Per1fl/fl, AAV8-TBG-GFP) and Per1iLKO (Per1fl/fl, AAV8-TBG-Cre) mice. (L) Serum non-esterified fatty acid (NEFA) (left), ketone body (middle), and hepatic triglyceride (TG) level from mice in (K); n = 4–6. (M) Representative images from oil red O (ORO)-stained liver tissue in (K). Scale bar, 100 μm. (N) Unsupervised hierarchical clustering of all differentially regulated genes (p < 0.05) from bulk RNA sequencing in liver harvested from (K); n = 3. (O) Relative expression level of Per1, Fgf21, and Pdk4 in liver harvested from mice in (K); n = 4–6. (P) Serum FGF21 protein level measured by ELISA from mice in (K); n = 4–6. Data expressed as mean ± SEM. */a/#p < 0.05, **/aa/##p < 0.01, ***/aaa/###p < 0.001, ****/aaaa/####p < 0.0001 by one-way ANOVA (B), Student’s t test (D, G), Pearson correlation test (E), and two-way ANOVA (H, I, L, O, P). See also Figure S1.
Figure 2.
Figure 2.. Single-nucleus multiome sequencing reveals that Per1 drives chromatin remodeling in a hepatocyte subpopulation
(A) Uniform manifold approximation and projection for dimension reduction (UMAP) plot on single-nucleus multiome sequencing analysis of liver tissues from Per1fl/fl and Per1cLKO (Per1fl/fl, Alb-Cre) fed ad libitum or fasted for 16 h (left). Nine major cell types were identified (right). In total, 9,871 (Per1fl/fl Feed), 8,702 (Per1fl/fl Fast), 9,494 (Per1cLKO Feed), and 8,731 (Per1cLKO Fast) nuclei were analyzed in each condition; n = 3. (B) Kyoto Encyclopedia of Genes and Genomes (KEGG) pathway analysis of differentially expressed genes (DEGs) between hepatocyte populations from Per1cLKO Fast group and Per1fl/fl Fast group. (C) Gene set enrichment analysis of circadian rhythm pathway between DEGs from hepatocytes in Per1cLKO Fast group and Per1fl/fl Fast group. (D) KEGG pathway analysis of differentially expressed peak signals between hepatocyte population from Per1cLKO Fast group and Per1fl/fl Fast group. (E) Enriched motifs identified in hepatocyte population from Per1cLKO Fast group. (F) Quantification of normalized peak level at region chr7-45615005-45616587 in hepatocyte population from each group. In total, 9,267 (Per1fl/fl Feed), 7,626 (Per1fl/fl Fast), 5,445 (Per1cLKO Feed), and 5,525 (Per1cLKO Fast) nuclei were identified as hepatocytes and analyzed in each condition; n = 3. (G) Coverage plot at Fgf21 locus from hepatocyte population. Functional units were identified based on the Encyclopedia of DNA Elements (ENCODE) database. (H) Relative expression of Per1 and Fgf21 in AML12 cells treated with siRNA targeting Ppara, Esrrg, or Atf1 followed by medium change to complete or starvation medium; n = 3. Data expressed as mean ± SEM. */a/#p < 0.05, **/aa/##p < 0.01, ***/aaa/###p < 0.001, ****/aaaa/####p < 0.0001 by two-way ANOVA (H). See also Figure S2 and Table S1.
Figure 3.
Figure 3.. Hepatocyte subpopulation analysis demonstrates enhanced glucose oxidation in fasting Per1LKO hepatocytes
(A) Hepatocyte subpopulation selection based on the normalized peak signal at chr7-45615005-45616587 region. Quantification of the normalized peak signal in each group. In total, of 144 (Per1fl/fl Feed), 165 (Per1fl/fl Fast), 145 (Per1cLKO Feed), and 253 (Per1cLKO Fast) nuclei were identified as Fgf21high hepatocyte subpopulation and analyzed in each condition; n = 3. (B) Selected hepatocyte subpopulation distribution in the UMAP based on the treatment. (C) Coverage plot at Fgf21 locus from selected hepatocyte subpopulation (Fgf21high) and their corresponding Per1 expression level. (D) Farnesoid X receptor (FXR)/pregnane X receptor (PXR)/bile acid pathway analysis from Comprehensive Multi-omics Platform for Biological Interpretation (COMPBIO) from differentially regulated genes in Fgf21high hepatocyte subpopulation from Per1cLKO Fast group and Per1fl/fl Fast group. (E) KEGG pathway analysis of DEGs from Fgf21high hepatocyte subpopulation between Per1cLKO Fast group and Per1fl/fl Fast group. (F) Gene ontology (GO) pathway analysis of DEGs from Fgf21high hepatocyte subpopulation between Per1iLKO Fast group and Per1fl/fl Fast group. (G) Seahorse XF Cell Mito Stress analysis of AML12 cells transduced with Ad-GFP or Ad-shPer1 for 48 h followed by medium change to either complete or starvation medium for 6 h (left), and area under the curve (AUC) quantification of the maximal respiration rate (right); n = 12. (H) Seahorse XF glucose/pyruvate oxidation stress analysis of AML12 cells treated with Fgf21 antisense oligonucleotide (ASO) for 48 h followed by medium change to either complete or starvation medium for 6 h (left), and AUC quantification of the inhibited maximal respiration rate (right); n = 12. (I) Seahorse XF long-chain fatty acid oxidation stress analysis of AML12 cells treated with Fgf21 antisense oligonucleotide (ASO) for 48 h followed by medium change to either complete or starvation medium for 6 h (left), and AUC quantification of the inhibited maximal respiration rate (right); n = 12. Data expressed as mean ± SEM. */a/#p < 0.05, **/aa/##p < 0.01, ***/aaa/###p < 0.001, ****/aaaa/####p < 0.0001 by two-way ANOVA (G–I). See also Figure S2 and Table S2.
Figure 4.
Figure 4.. Fasting induces Per1, Fgf21, and Pdk4 independent of the core circadian clock
(A and C) Schematic of in vitro feed/starve experiment in AML12 cells treated with either adenovirus or siRNA targeting Per1, Bmal1, Clock, or Cry1. (B) Relative expression level of Per1, Fgf21, and Pdk4 in AML12 cells treated with Ad-GFP or Ad-shPer1, fed or starved; n = 5. (D) Relative expression level of Per1, Fgf21, and Pdk4 in AML12 cells treated with lipofectamine (Control), siBmal1, siClock, or siCry1, fed or starved; n = 3. (E) Schematic of ex vivo primary hepatocyte starvation experiment from Per2WT and Per2KO female mice. (F) Relative expression level of Per1, Fgf21, and Pdk4 in primary hepatocytes isolated from Per2WT or Per2KO mice, fed or starved; n = 3–4. (G) Schematic of in vivo time-course experiment in Bmal1fl/fl and Bmal1cLKO (Bmal1fl/fl, Alb-Cre) mice. Mice were either fed ad libitum or fasted for 16 h, and liver tissues were harvested every 4 h in a 24-h duration; n = 3–4. (H) Relative expression level of Per1, Fgf21, and Pdk4 (normalized to ZT0 Bmal1fl/fl feed) from liver in (G). (I) Correlation test result between normalized expression level of Per1 and Fgf21 (−8 h or +16 h) (left), Per1 and Pdk4 (−8 h or + 16 h) (middle), and Fgf21 and Pdk4 (right) in (H). Dotted line denotes the 95% confidence interval for the simple linear regression calculation. (J) Schematic of the 14 h + 2 h fast/refeed experimental design in Bmal1fl/fl (Bmal1fl/fl, AAV8-TBG-GFP) and Bmal1iLKO (Per1fl/fl, AAV8-TBG-Cre) mice; n = 3–5. (K) Serum glucose (left), NEFA (middle), and hepatic TG (right) level from mice in (J). (L) Relative expression level of liver Bmal1, Per1, Fgf21, Pdk4, and Ppara from mice in (J). Data expressed as mean ± SEM. */a/#p < 0.05, **/aa/##p < 0.01, ***/aaa/###p < 0.001, ****/aaaa/####p < 0.0001 by two-way ANOVA (B, F, K, L), Student’s t test (D), and Pearson correlation test (I). See also Figures S3 and S4.
Figure 5.
Figure 5.. PDH inhibition restores substrate predilection from glucose to fatty acid in Per1LKO-fasted mice
(A) Schematic of the fasting-induced Pdk4-mediated inhibition of glucose oxidation. (B) Respiratory exchange ratio (RER) measured during 16 h of fasting in Per1fl/fl and Per1cLKO (Per1fl/fl, Alb-Cre) mice in indirect calorimetry (left), and quantification of RER during fasting from ZT12 to ZT20 and ZT20 to ZT4 (right); n = 6. (C) Glucose oxidation rate calculated based on VCO2 and VO2 during fasting. Shade denotes SEM (left) and quantification (right) from mice in (B); n = 6. (D) Relative expression level of Per1 in liver from Per1fl/fl or Per1cLKO mice underwent 14 h + 2 h fast/refeed; n = 3. (E) Immunoblot analysis of liver tissues from (D), quantification labeled on the top of each band (pPDHa1Ser293 was normalized to total PDH) (left), and quantification of pPDHa1Ser293 level normalized to Per1fl/fl refeed (right); n = 3. (F) Relative expression level of Per1 and Pdk4 from AML12 cells transduced with Ad-GFP or Ad-shPer1 for 48 h followed by medium change to either complete or starvation medium for 48 h; n = 3. (G) Immunoblot analysis of AML12 cells as described in (F) (left), and quantification of pPDHa1Ser293 and PDK4 (right); n = 3. (H) Immunoblot analysis of AML12 cells as described in (F), with additional treatment of 25 μM CPI-613 2 h prior to harvest in Ad-shPer1-treated cells (left). Quantification of pPDHα1Ser293 (right); n = 3. (I) pPDHa1Ser293 quantification from shPer1-treated AML12 cells with or without CPI-613 from (G) and (H). pPDHa1Ser293 level was normalized to corresponding Ad-GFP-treated cells cultured in complete medium; n = 3. (J) RER measured during 16 h of fasting in Per1fl/fl and Per1cLKO mice in indirect calorimetry injected with either vehicle or 25 mg/kg CPI-613 at ZT20; n = 3. Data expressed as mean ± SEM. */a/#p < 0.05, **/aa/##p < 0.01, ***/aaa/###p < 0.001, ****/aaaa/####p < 0.0001 by two-way ANOVA (B, D–J) and Student’s t test (C). See also Figure S5.
Figure 6.
Figure 6.. FGF21 drives the Pdk4-mediated inhibition of glucose oxidation during fasting
(A) Schematic of the 14 h + 2 h fast/refeed experimental design in Fgf21fl/fl and Fgf21cLKO (Fgf21fl/fl, Alb-Cre) mice. (B) Diagram of differentially regulated gene (p < 0.05) distribution in fasted liver found in Per1iLKO and Fgf21cLKO mice compared to corresponding floxed control fasted mice; n = 3. (C) Heatmap of the 53 overlapped genes found in (B) and their log fold change (logFC). (D) Relative expression level of Fgf21 and Pdk4 in liver harvested from (A); n = 4–5. (E) Schematic of in vivo tracing experiment. In brief, [U-13C]glucose was infused to Per1fl/fl or Per1iLKO mice that underwent 14 h + 2 h fast/refeed, with or without injection of 1 mg/kg FGF21; n = 3. (F) Schematic of 13C-labeled (gray) and unlabeled carbon (white) distribution from [U-13C]glucose in glycolysis and PDH-mediated tricarboxylic acid (TCA) cycle. (G) Hepatic percent enrichment of correspondingly labeled metabolites involved in glycolysis and PDH-mediated TCA cycle in fasted mice from (E); n = 3. (H) RER measured in Per1WT and Per1cLKO (Per1fl/fl, Alb-Cre) mice injected with either vehicle or mouse FGF21 recombinant protein (1 mg/kg) after 8 h of fasting (fasting started at ZT12); n = 3. (I) Relative expression level of Pdk4 in liver harvested from (H); n = 3. (J) Schematic of the regulatory pathway Per1-Fgf21-Pdk4-PDH during fasting. Data expressed as mean ± SEM. */a/#p < 0.05, **/aa/##p < 0.01, ***/aaa/###p < 0.001, ****/aaaa/####p < 0.0001 by two-way ANOVA (D, G) and Student’s t test (I). See also Figure S6.

References

    1. Rui L. (2014). Energy metabolism in the liver. Compr. Physiol 4, 177–197. - PMC - PubMed
    1. Adeva-Andany MM, Perez-Felpete N, Fernandez-Fernandez C, Donapetry-Garcia C, and Pazos-Garcia C (2016). Liver glucose metabolism in humans. Biosci. Rep 36, e00416. - PMC - PubMed
    1. Burgess SC, Jeffrey FMH, Storey C, Milde A, Hausler N, Merritt ME, Mulder H, Holm C, Sherry AD, and Malloy CR (2005). Effect of murine strain on metabolic pathways of glucose production after brief or prolonged fasting. Am. J. Physiol. Endocrinol. Metab 289, E53–E61. - PubMed
    1. Jones JG (2016). Hepatic glucose and lipid metabolism. Diabetologia 59, 1098–1103. - PubMed
    1. Saponaro C, Gaggini M, Carli F, and Gastaldelli A (2015). The Subtle Balance between Lipolysis and Lipogenesis: A Critical Point in Metabolic Homeostasis. Nutrients 7, 9453–9474. - PMC - PubMed

Publication types

Substances