. 2024 Nov 26;43(11):114877.
doi: 10.1016/j.celrep.2024.114877. Epub 2024 Oct 15.

Activity-assembled nBAF complex mediates rapid immediate early gene transcription by regulating RNA polymerase II productive elongation

Affiliations

Activity-assembled nBAF complex mediates rapid immediate early gene transcription by regulating RNA polymerase II productive elongation

Karen G Cornejo et al. Cell Rep. .

Abstract

Signal-dependent RNA polymerase II (RNA Pol II) productive elongation is an integral component of gene transcription, including that of immediate early genes (IEGs) induced by neuronal activity. However, it remains unclear how productively elongating RNA Pol II overcomes nucleosomal barriers. Using RNAi, three degraders, and several small-molecule inhibitors, we show that the mammalian switch/sucrose non-fermentable (SWI/SNF) complex of neurons (neuronal BRG1/BRM-associated factor or nBAF) is required for activity-induced transcription of neuronal IEGs, including Arc. The nBAF complex facilitates promoter-proximal RNA Pol II pausing and signal-dependent RNA Pol II recruitment (loading) and, importantly, mediates productive elongation in the gene body via interaction with the elongation complex and elongation-competent RNA Pol II. Mechanistically, RNA Pol II elongation is mediated by activity-induced nBAF assembly (especially ARID1A recruitment) and its ATPase activity. Together, our data demonstrate that the nBAF complex regulates several aspects of RNA Pol II transcription and reveal mechanisms underlying activity-induced RNA Pol II elongation. These findings may offer insights into human maladies etiologically associated with mutational interdiction of BAF functions.

Keywords: Arc; BD98; CP: Molecular biology; CP: Neuroscience; RNA Pol II; RNA polymerase II; SWI/SNF; immediate early gene; nBAF; neuron; productive elongation; transcription.


Conflict of interest statement

Declaration of interests The authors declare no competing interests.

Figures

Figure 1.
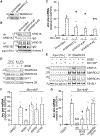
Figure 1.. BAF complex is required for optimal Arc transcription
(A) Schematic representation of three biochemically distinct BAF complexes: nBAF (neuronal cBAF), GBAF, and PBAF. Complex-defining unique subunits are represented in colors. Subunits shared by all three complexes are not indicated. Degraders and small-molecule inhibitors to target each complex are noted below. Schematic was created using BioRender. (B) Neurons were treated with DMSO (control) or the indicated concentrations of ACBI1 or cis-ACBI1 (inactive isomer of ACBI1) for 3 h. Whole-cell lysates were electrophoresed, western blotted, and probed for the indicated BAF subunits. (C–E) Neuronal lysates were used to immunoprecipitate SMARCA4 (C), ARID1A (D), and ARID1B (E). Five percent of the cell lysate was used as input. Histone 3 and IgG are depicted as loading controls. (F and G) Transcriptional assays in which Arc pre-mRNA normalized by GAPDH pre-mRNA levels is illustrated. (F) Neurons were treated with ACBI1 or cis-ACBI1 for 3 h followed by bicuculline and 4AP treatment for 15 min (Bic + 4AP). (G) Neurons were treated with BAF ATPase domain inhibitors BRM014 and FHT for 30 min, followed by Bic + 4AP treatment to induce neuronal activity. Gray dots represent biological replicates, error bars show SE of the mean. *p < 0.05 and **p < 0.01. One-way ANOVA was followed by Tukey’s post hoc test. Approximate position of the nearest molecular weight marker is depicted against each band.
Figure 2.
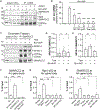
Figure 2.. RNAi-dependent depletion and pharmacological perturbation of nBAF complex subunits attenuate Arc transcription
(A and B) Protein levels indicating knockdown of SMARCC2 and ARID1A. Neurons were infected with lentiviruses to deliver short hairpin RNA (shRNA) targeted against SMARCC2 (3 days) or ARID1A (5 days). Scrambled shRNA was used as control. Knockdown of SMARCC2 (A; whole-cell lysate) and ARID1A (B; immunoprecipitation of whole-cell lysate) was verified by protein levels. Specificity of ARID1A RNAi is depicted by immunoprecipitation of ARID1B, whose levels remained unaffected. (C) Neurons depleted of the indicated nBAF subunits were treated with bicuculline and 4AP (Bic + 4AP; neuronal activity) for 15 min. Normalized Arc pre-mRNA levels are displayed. (D) Cellular thermal shift assay (CETSA) was performed on live cells treated with BD98 (20 μM) for 30 min. Cell lysates were then analyzed via western blot to assess thermal stability of SMARCC2, SMARCA4, and nBAF-specific DPF1. All three BAF subunits displayed stability at higher temperature in BD98-treated neurons, indicating direct binding of the inhibitor with the nBAF complex. (E) CoIP assay was performed in lysates from neurons preincubated with BD98 (5 μM) followed by Bic + 4AP treatment for 15 min. Anti-SMARCC2 immunoprecipitated samples were separated on a gel and blotted for other BAF subunits. Five percent of the cell lysate was used as input. (F) Neurons were preincubated for 30 min with BD98 (20 μM), BRD7i (5 μM), and BRD9i (0.2 μM) to inhibit nBAF, PBAF, and GBAF, respectively, followed by Bic + 4AP for 15 min. Normalized Arc pre-mRNA levels are displayed. (G) Similar to the assay in (F), except neurons were preincubated with the indicated doses of BD98. Negative BD98 was used as a control. Gray dots represent biological replicates, and error bars show SE of the mean. *p < 0.05 and **p < 0.01. One-way ANOVA was performed followed by Tukey’s post hoc test. Approximate position of the nearest molecular weight marker is depicted against each band.
Figure 3.
Figure 3.. Neuronal activity dynamically assembles nBAF
(A) Immunoprecipitation coupled with mass spectrometry (IP-MS) to investigate changes in the interaction between nBAF subunits in neurons before and after neuronal activity. Cell lysates were immunoprecipitated using an anti-SMARCC2 antibody. Bicuculline treatment and control samples were processed for liquid chromatography-tandem mass spectrometry (LC-MS/MS) analysis. Student’s t test was performed, and the difference in log2 fold change on averages was calculated. p values and log2 fold change (difference) were used to create a volcano plot. p < 0.05 and difference thresholds >0.0 and <0.0 (fold change = 2^difference) were used. (B) Neurons were fractionated into cellular compartments (cytoplasm, nucleoplasm, and chromatin) to isolate the chromatin-bound proteins. Equal percentages of total cell lysate were analyzed via western blot to assess quality of fractionation. (C) Chromatin fractionation was used and anti-SMARCC2 immunoprecipitated samples were separated on a gel and blotted for other BAF subunits. (D) Quantification of (C). Individual band intensity values for ARID1A and SMARCC2 were obtained from Image Lab Bio-Rad software. Interaction was assessed by plotting the ratio of ARID1A and SMARCC2 in each treatment. (E) RNA was extracted from the chromatin fraction, and nascent RNAs for indicated genes were assayed. They are displayed as a heatmap (normalized by GAPDH nascent RNA). Values and statistics for individual genes are shown in Figure S3. Gray dots represent biological replicates; error bars show SE of the mean. *p < 0.05.
Figure 4.
Figure 4.. The nBAF complex aids activity-induced RNA Pol II recruitment to the Arc promoter
(A) Schematic representation of Arc to show promoter, exons, introns, and primer positions used to quantify immunoprecipitated chromatin in this and other figures. TSS, transcription start site. (B–G) In (B)–(D), neurons were SMARCC2 depleted by RNAi and knockdown was confirmed by independent western blots (not shown). Sc, scrambled shRNA as control. In (E)–(G), neurons were incubated with ACBI (3 h, 2.5 μM) to degrade SMARCA4. ChIP assays were subsequently performed for all treatments (B)–(G). (B and E) Quantified paused RNA Pol II binding near the Arc promoter determined by ChIP with an antibody against Rpb1 phosphorylated at serine 5 in the CTD (Rpb1-pSer5). (C and F) Quantified total RNA Pol II binding near the Arc promoter determined by ChIP with antibody against Rpb1-NTD. (D and G) Quantified SMARCC2 binding near the Arc promoter determined by ChIP with antibody against SMARCC2. Gray dots represent biological replicates; error bars show SE of the mean. *p < 0.05, **p < 0.01, and ***p < 0.001. One-way ANOVA followed by Tukey’s post hoc test was performed.
Figure 5.
Figure 5.. The nBAF complex interacts with and is regulated by RNA Pol II EC
(A) Neurons were incubated for 3 h with ACBI (2.5 μM), and activity was induced by Bic + 4AP for 15 min. CoIP was then performed in neuronal lysates with anti-CDK9. CoIP samples were separated on a gel and blotted for other BAF subunits. SMARCA4 is used as a control to show ACBI efficiency. Spt6 is part of the elongation complex. (B) Neurons were incubated with MC180 or Thal-SNS-032 for 20 min or 3 h, respectively, followed by activity induction for 15 min with Bic + 4AP. Normalized Arc pre-mRNA levels were assayed and are displayed. (C) Neurons were treated as indicated and fractionated. The chromatin fraction was used, and anti-SMARCC2 coIP samples were electrophoresed and blotted for other BAF subunits. ARID1A is shown on a blot separate from the others. The ARID1A loading control (SMARCC2) is not displayed here to avoid duplication but is quantified in (D). (D and E) Quantification of (C) for ARID1A and SS18L1, respectively (normalized by SMARCC2). Quantification was performed as described for Figure 3. (F) ChIP data to show SMARCC2 binding inside the Arc gene body 15 min after stimulation of wild type or neurons depleted of the subunit. (G) Quantified elongating RNA Pol II binding inside the Arc gene body, 15 min after stimulation, determined by ChIP with antibody against Rpb1-pSer2. (H) Quantified SMARCC2 binding inside the Arc gene body, after identical stimulation as in (G), determined by ChIP with antibody against SMARCC2. Gray dots represent biological replicates; error bars show SE of the mean. *p < 0.05, **p < 0.01, and ***p < 0.001. One-way ANOVA was performed followed by Tukey’s post hoc test.
Figure 6.
Figure 6.. The nBAF complex interacts with elongation-competent RNA Pol II
(A) Neurons were incubated with BD98 (20 min, 5 μM) and activity was induced by Bic + 4AP for 15 min. Interactions between Rpb1-pS2 and the indicated nBAF subunits were assessed using whole-cell lysates. (B) Quantification of the dataset displayed in (A). Individual band intensities for SMARCC2 and Rpb1-pSer2 were obtained with the ImageLab Bio-Rad software. Interaction was assessed by plotting the ratio of Rpb1-pSer2 and SMARCC2 in each treatment. (C) Cells were treated as noted and fractionated. The chromatin fraction was used, and anti-SMARCC2 immunoprecipitated samples were electrophoresed and blotted for pSer2-Rpb1. (D) Quantification of the dataset displayed in (C), performed as in (B). (E) ChIP data demonstrating SMARCC2 binding inside the Arc gene body in response to 15 min of activity in the presence or absence of BD98 or ACBI1. Gray dots represent biological replicates; error bars show SE of the mean. *p < 0.05, **p < 0.01, and **p < 0.001. One-way ANOVA was performed followed by Tukey’s post hoc test.
Figure 7.
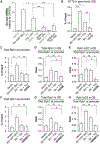
Figure 7.. Assembled complex and its ATPase activity are required for RNA Pol II productive elongation
(A) Neurons, as indicated, were incubated with BD98 (5 μM) or BRM014 (5 μM) for 20 and 10 min, respectively, and co-treated with triptolide (1 μM) and Bic + 4AP for 10 min. Activity-induced Arc transcription was quantified by Arc pre-mRNA levels (normalized by GAPDH pre-mRNA). (B–E) Neurons were incubated with BD98 for 20 min and co-treated with triptolide and Bic + 4AP as indicated. ChIP assays were performed with antibodies against SPT6, Rpb1-NTD, and Rpb1-pS2. Levels of SPT6 in the Arc gene body are displayed in (B). Total RNA Pol II levels at the Arc promoter are displayed in (C). Total RNA Pol II levels in the gene body, normalized to total RNA Pol II at the promoter, are shown in (D). Rpb1-pS2 levels in the gene body, normalized to total RNA Pol II at the promoter, are displayed in (E). (F–H) In a parallel set of experiments, neurons were treated as in (B)–(E), except they were incubated with BRM014 prior to experiencing activity. Total RNA Pol II levels at the Arc promoter are displayed in (F). Total RNA Pol II levels in the gene body, normalized to total RNA Pol II at the promoter, are shown in (G). Rpb1-pS2 levels in the gene body, normalized to total RNA Pol II at the promoter, are displayed in (H). Gray dots represent biological replicates; error bars show SE of the mean. *p < 0.05, **p < 0.01, and **p < 0.001. One-way ANOVA statistical analyses were performed followed by Tukey’s post hoc test.

Update of

References

    1. Stern M, Jensen R, and Herskowitz I (1984). Five SWI genes are required for expression of the HO gene in yeast. J. Mol. Biol 178, 853–868. 10.1016/0022-2836(84)90315-2. - DOI - PubMed
    1. Cairns BR, Kim YJ, Sayre MH, Laurent BC, and Kornberg RD (1994). A multisubunit complex containing the SWI1/ADR6, SWI2/SNF2, SWI3, SNF5, and SNF6 gene products isolated from yeast. Proc. Natl. Acad. Sci. USA 91, 1950–1954. 10.1073/pnas.91.5.1950. - DOI - PMC - PubMed
    1. Neigeborn L, and Carlson M (1984). GENES AFFECTING THE REGULATION OF SUC2 GENE EXPRESSION BY GLUCOSE REPRESSION IN SACCHAROMYCES CEREVISIAE. Genetics 108, 845–858. 10.1093/genetics/108.4.845. - DOI - PMC - PubMed
    1. Dingwall AK, Beek SJ, McCallum CM, Tamkun JW, Kalpana GV, Goff SP, and Scott MP (1995). The Drosophila snr1 and brm proteins are related to yeast SWI/SNF proteins and are components of a large protein complex. Mol. Biol. Cell 6, 777–791. 10.1091/mbc.6.7.777. - DOI - PMC - PubMed
    1. Wang W, Cộté J, Xue Y, Zhou S, Khavari PA, Biggar SR, Muchardt C, Kalpana GV, Goff SP, Yaniv M, et al. (1996). Purification and biochemical heterogeneity of the mammalian SWI-SNF complex. EMBO J. 15, 5370–5382. 10.1002/j.1460-2075.1996.tb00921.x. - DOI - PMC - PubMed

Publication types