. 2024 Dec;11(45):e2404130.
doi: 10.1002/advs.202404130. Epub 2024 Oct 16.

Programmed BRD9 Degradation and Hedgehog Signaling Activation via Silk-Based Core-Shell Microneedles Promote Diabetic Wound Healing

Affiliations

Programmed BRD9 Degradation and Hedgehog Signaling Activation via Silk-Based Core-Shell Microneedles Promote Diabetic Wound Healing

Yili Liu et al. Adv Sci (Weinh). 2024 Dec.

Abstract

Wound healing impairment in diabetes mellitus is associated with an excessive inflammatory response and defective regeneration capability with suppressed Hedgehog (Hh) signaling. The bromodomain protein BRD9, a subunit of the non-canonical BAF chromatin-remodeling complex, is critical for macrophage inflammatory response. However, whether the epigenetic drug BRD9 degrader can attenuate the sustained inflammatory state of wounds in diabetes remains unclear. Without a bona fide immune microenvironment, Hh signaling activation fails to effectively rescue the suppressed proliferative ability of dermal fibroblasts and the vascularization of endothelial cells. Therefore, a silk-based core-shell microneedle (MN) patch is proposed to dynamically modulate the wound immune microenvironment and the regeneration process. Specifically, the BRD9 degrader released from the shell of the MNs mitigated the excessive inflammatory response in the early phase. Subsequently, the positively charged Hh signaling agonist is released from the negatively charged core of the silk fibroin nanofibers and promotes the phase transition from inflammation to regeneration, including re-epithelialization, collagen deposition, and angiogenesis. These findings suggest that the programmed silk-based core-shell MN patch is an ideal therapeutic strategy for effective skin regeneration in diabetic wounds.

Keywords: Hedgehog signaling; diabetes; microneedle patch; silk fibroin nanofibers; wound healing.


Conflict of interest statement

The authors declare no conflict of interest.

Figures
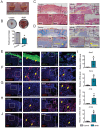
Figure 1
Figure 1
Excessive inflammation and inhibited dermal regeneration in diabetic wound healing. A) Representative image of the mouse dorsal wound healing model. B) Representative image and quantification of wound healing expressed as the % of wound closure in wild‐type (WT) and db/db mice 9 days after surgery. Data presented as the mean ± SD, n = 3. P‐values were calculated using a two‐tailed Student's t‐test. *P < 0.05. C) Representative H&E and D) Masson's trichrome staining images of wound healing in WT and db/db mice 9 days after surgery. The yellow arrow indicates the collagen bundles. Epi, epidermis; derm, dermis. Immunofluorescence staining for E) KRT14 (green), F) PECAM1 (red), G) NOS2 (red), H) STAT1 (red), and J) Ki67 (red) in the wounds of WT and db/db mice 9 days after surgery. The yellow arrows indicate positive signals. I) The mRNA expression of Nos2, Tnf‐α, Il‐1β, and Il‐12α in the wounds of WT and db/db mice 3 days after surgery, as measured by qPCR. Data are presented as the mean ± SD, n = 3. P‐values were calculated using two‐tailed Student's t‐test, *P < 0.05. Scale bar, 200 µm.
Figure 2
Figure 2
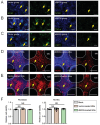
Anti‐inflammatory effects and biocompatibility of BRD9 degrader‐loaded MNs in vitro. Immunofluorescence staining for A) NOS2 (green), B) TNF‐α (green), and C) STAT1 (green) in dBRD9‐ or control vector‐treated macrophage RAW 264.7 cells after LPS stimulation. Yellow arrows indicate positive signals. Immunofluorescence staining for D) NOS2 (red) and E) STAT1 (red) in RAW 264.7 macrophage cells on dBRD9‐ or control vector‐loaded MNs under LPS stimulation. F) Cell viability of dermal fibroblasts and HUVECs cultured in the extracted solutions from control vector‐loaded MNs and the dBRD9‐loaded MNs for 24 h. A blank solution served as the control. Data are presented as the mean ± SD. P‐values were calculated using ANOVA with Dunnett's multiple comparisons test. For fibroblasts, n = 6. For HUVECs, n = 7. NS, not significant, P >0.05. Scale bar, 200 µm.
Figure 3
Figure 3
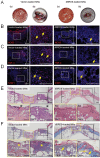
BRD9 degrader‐loaded MNs mitigate excessive inflammation in diabetic wound healing. A) Representative image of the wound healing of dBRD9‐loaded MNs and the control group in db/db mice at day 0 and day 8 after surgery. Immunofluorescence staining for B) NOS2 (red), C) TNF‐α (red), and D) STAT1 (red) in the wounds of the dBRD9‐loaded MNs group compared with the control group in db/db mice 8 days after surgery. Yellow arrows indicate positive signals. E) Representative H&E and F) Masson's staining images of wound healing in the dBRD9‐loaded MNs group and the control group of db/db mice 8 days after surgery. The yellow arrows indicate the collagen bundles. The asterisk indicates compromised re‐epithelialization in e and defective collagen deposition in f. Epi, epidermis; derm, dermis. Scale bar, 200 µm.
Figure 4
Figure 4
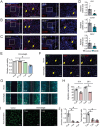
Downregulated Hedgehog signaling impairs dermal regeneration in DM. a‐c. Immunofluorescence staining for A) GLI1 (red), B) CCND1 (red), and C) PTCH1 (red) in the wounds of WT and db/db mice 9 days after surgery. White dashed lines mark the wound boundaries. Yellow arrows indicate positive signals. D) Gli1, Ccnd1, and Ptch1 mRNA expression in the wounds of WT and db/db mice 3 days after surgery, as measured by qPCR. Data are presented as the mean ± SD, n = 5. P‐values were calculated using a two‐tailed Student's t‐test. *P < 0.05. E) Cell viability of dermal fibroblasts treated with vismodegib for 2 days, as determined using a Cell Counting Kit‐8 assay. Data are presented as the mean ± SD, n = 5. P‐values were calculated using ANOVA with Dunnett's multiple comparisons test. *P < 0.05. F) Immunofluorescence staining for Ki67 (red) and visualization of EdU (green) in dermal fibroblasts after treatment with 1 µm vismodegib or control vector for 24 h. Yellow arrows indicate proliferating cells. G) Representative images and H) quantification of the in vitro scratch assay results of dermal fibroblasts after treatment with 1 µm vismodegib or control vector for 0, 19, and 28 h. Dotted lines indicate the initial scratch edges. Data are presented as the mean ± SD, n = 4. P‐values were calculated using a two‐tailed Student's t‐test, *P < 0.05. I) Representative images and J) quantification of HUVEC tube formation after treatment with 1 µm vismodegib or control vector for 2 h. Data are presented as the mean ± SD, n = 5. P‐values were calculated using ANOVA with Dunnett's multiple comparisons test, *P < 0.05. Scale bar, 200 µm.
Figure 5
Figure 5
Hedgehog signaling activation fails to promote regeneration under inflammatory conditions. A) GLI1 and CCND1 protein expression in dermal fibroblasts treated with SAG or the control vector for 2 days. B) Cell proliferation fold change in dermal fibroblasts at 24, 48, and 72 h after co‐culture within RAW 264.7 cells supernatant with (sti‐RAW) or without LPS stimulation and supplemented with a vector or 1 µm SAG, as determined using a Cell Counting Kit‐8 assay. Data presented as the mean ± SD, n = 5 biologically independent samples. P‐values were calculated using ANOVA with Tukey's multiple comparisons test. *P < 0.05. NS, not significant, P > 0.05. C) Immunofluorescence staining for Ki67 (red) and visualization of EdU (green) in dermal fibroblasts after co‐culture within the supernatant of sti‐RAW 264.7 cells or RAW 264.7 cells without LPS stimulation supplemented with vector or 1 µm SAG for 48 h. D) Representative images and E) quantification of the results of the in vitro scratch assay of dermal fibroblasts co‐cultured within the supernatant of sti‐RAW 264.7 cells or RAW 264.7 cells without LPS stimulation supplemented with vector or 1 µm SAG for 48 h. Dotted lines indicate the initial scratch edges. Data are presented as the mean ± SD, n = 4. P‐values were calculated using ANOVA with Tukey's multiple comparisons test. *P < 0.05. NS, not significant, P > 0.05. F) Representative images and G) quantification of tube formation in HUVECs co‐cultured within the supernatant of sti‐RAW 264.7 cells or RAW 264.7 cells without LPS stimulation supplemented with vector or 1 µm SAG for 2 h. Data are presented as the mean ± SD, n = 5. P‐values were calculated using ANOVA with Tukey's multiple comparisons test, *P < 0.05. NS, not significant, P > 0.05. Scale bar, 200 µm.
Figure 6
Figure 6
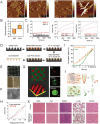
Fabrication and characterizations of the silk‐based core‐shell MN patch. A) AFM detection of the binding interaction between SAG and SNF. Scale bars: left panel, 2 µm; right panel, 600 nm. B) Zeta potential of SNF and SAG. C) Oscillatory time sweep analysis at a constant frequency of 1 Hz for SNF‐RSF hydrogel. D) Schematic diagram of the silk‐based core‐shell MN patch construction. E) Representative images of the silk‐based core‐shell MN patch. Scale bar, 1 mm. F) SEM observation of MN morphology. Scale bar, 100 µm. G) Confocal microscopy observation of the fluorescently labeled core‐shell MN patch (Rhodamine 6G‐labeled shell, FAM‐labeled core). Scale bar, 200 µm. H) Mechanical properties of the prepared MNs with core‐shell or shell structure. I) Cumulative release of model drugs from the core‐shell MN patch in vitro. n = 6. J) Schematic diagram of the gradient drug release capability of the core‐shell MNs. K) Tissue sections of the heart, liver, lungs, spleen, and kidneys of wild‐type mice treated with or without the silk‐based core‐shell MN patch for 10 days. Scale bar, 100 µm.
Figure 7
Figure 7
The silk‐based core‐shell MN patch inhibits excessive inflammation and activates Hedgehog signaling in a programmable manner. Immunofluorescence staining for A) NOS2 (red), B) STAT1 (red), and C) TNF‐α (red) in the wounds of the dBRD9/SAG‐loaded MNs group compared with the control group of db/db mice 3 days after surgery. Immunofluorescence staining for D) GLI1 (red), E) CCND1 (red), and F) PTCH1 (red) in the wounds of the control and dBRD9/SAG‐loaded MNs group of db/db mice 8 days after surgery. White dashed lines mark the wound boundary. Yellow arrows indicate positive signals. Scale bar, 200 µm.
Figure 8
Figure 8
The silk‐based core‐shell MN patch promotes wound healing in HFD/STZ‐induced type‐2 diabetic mice. A) Representative image and B) quantification of the wound healing after treatment with dBRD9‐loaded MNs, SAG‐loaded MNs, and dBRD9/SAG‐loaded MNs compared with the control group of HFD/STZ‐induced type 2 diabetic mice 8 days after surgery. Data are presented as the mean ± SD, n = 3. P‐values were calculated using ANOVA with Tukey's multiple comparisons test. *P < 0.05. NS, not significant, P > 0.05. C) Representative H&E and D) Masson's trichrome staining images of wound healing after treatment with dBRD9‐loaded MNs, SAG‐loaded MNs, and dBRD9/SAG‐loaded MNs compared with the control group of HFD/STZ‐induced type‐2 diabetic mice 8 days after surgery. Black dashed lines mark the wound boundary. White dashed lines indicate the dermis. The yellow arrow in D) indicates the collagen bundles. The asterisks indicate infiltrating inflammatory cells. Epi, epidermis; derm, dermis; inflam, infiltrating inflammatory cell. Quantification of E) re‐epithelialization percentage and F) collagen deposition percentage after treatment with dBRD9‐loaded MNs, SAG‐loaded MNs, and dBRD9/SAG‐loaded MNs compared with the control group of HFD/STZ‐induced type 2 diabetic mice 8 days after surgery. Data are presented as the mean ± SD, n = 3. P‐values were calculated using ANOVA with Tukey's multiple comparisons test. *P < 0.05. NS, not significant, P > 0.05. Scale bar, 200 µm.

References

    1. Hossain M. J., Al‐Mamun M., Islam M. R., Health Sci. Rep. 2024, 7, e2004. - PMC - PubMed
    1. Roglic G., Int. J. Noncommun. Dis. 2016, 1, 3.
    1. Geraghty T., LaPorta G., Expert Rev. Pharmacoecon. Outcomes Res. 2019, 19, 279. - PubMed
    1. Baltzis D., Eleftheriadou I., Veves A., Adv. Ther. 2014, 31, 817. - PubMed
    1. Spampinato S. F., Caruso G. I., De Pasquale R., Sortino M. A., Merlo S., Pharmaceuticals 2020, 13, 60. - PMC - PubMed

LinkOut - more resources