. 2024 Oct 22;121(43):e2406686121.
doi: 10.1073/pnas.2406686121. Epub 2024 Oct 16.

KCTD1 regulation of Adenylyl cyclase type 5 adjusts striatal cAMP signaling

Affiliations

KCTD1 regulation of Adenylyl cyclase type 5 adjusts striatal cAMP signaling

Yini Liao et al. Proc Natl Acad Sci U S A. .

Abstract

Dopamine transfers information to striatal neurons, and disrupted neurotransmission leads to motor deficits observed in movement disorders. Striatal dopamine converges downstream to Adenylyl Cyclase Type 5 (AC5)-mediated synthesis of cAMP, indicating the essential role of signal transduction in motor physiology. However, the relationship between dopamine decoding and AC5 regulation is unknown. Here, we utilized an unbiased global protein stability screen to identify Potassium Channel Tetramerization Domain 1 (KCTD1) as a key regulator of AC5 level that is mechanistically tied to N-linked glycosylation. We then implemented a CRISPR/SaCas9 approach to eliminate KCTD1 in striatal neurons expressing a Förster resonance energy transfer (FRET)-based cAMP biosensor. 2-photon imaging of striatal neurons in intact circuits uncovered that dopaminergic signaling was substantially compromised in the absence of KCTD1. Finally, knockdown of KCTD1 in genetically defined dorsal striatal neurons significantly altered motor behavior in mice. These results reveal that KCTD1 acts as an essential modifier of dopaminergic signaling by stabilizing striatal AC5.

Keywords: KCTD1; cAMP; dopamine; motor learning; striatum.


Conflict of interest statement

Competing interests statement:The authors declare no competing interest.

Figures

Fig. 1.
Fig. 1.
KCTD1 increases the protein level of AC5. (A) Scheme of imaging pipeline to transfect cells with AC5-Venus-P2A-mRuby3 and each individual KCTD ORF for confocal imaging fixed cells. (B) Representative confocal images of AC5 (Venus) and a housekeeping protein (mRuby3). The white scale bar represents 20 μm. (C) Superplot of the AC5 protein level. Each small dot represents Venus:mRuby3 ratio for a single cell, normalized to pcDNA control. Each large circle represents the average for one biological replicate. Colors are coded such that matched dots and circles represent the same replicate. Error bars and statistical tests were performed on the biological replicates of each sample (n = 4). One-way ANOVA was performed with Dunnett’s multiple comparisons test to pcDNA control. F = 8.965, R2 = 0.7418 (****P < 0.0001). (D) Relative Kctd expression in mouse striatal D1- and D2-MSNs, data curated from ref. . (E) Representative western blot of Flag-AC5-WT cells treated with cycloheximide (20 μg/mL final concentration) prior to lysis. (F) Quantification of the Flag-AC5-WT level (anti-Flag antibody) relative to 0-h cycloheximide treatment. n = 4 biological replicates. (G) Quantification of the Flag-AC5-WT level (anti-Flag antibody) at 0-h cycloheximide treatment (i.e., no treatment). n = 4 biological replicates, unpaired t test, P = 0.0077. (H) Quantification of the Flag-AC5-WT degradation rate, 1/τ, at 0-h cycloheximide treatment (i.e., no treatment). n = 4 biological replicates, unpaired t test, P = 0.0325. (I) Quantification of the Flag-AC5-WT level (anti-Flag antibody) at 4-h cycloheximide treatment. n = 4 biological replicates, unpaired t test, P = 0.0378. Unless indicated, all data are represented as mean ± SE of the mean. Also, SI Appendix, Fig. S1.
Fig. 2.
Fig. 2.
KCTD1 forms a complex with NGLY1 to increase the AC5 protein level. (A) IP of HA-NGLY1 from HEK293 cells with the anti-HA antibody followed by probing for KCTD1-myc-Flag with an anti-Flag antibody. Representative blot from three independent experiments. (B) IP of HA-NGLY1 from HEK293 cells with the anti-HA antibody followed by probing for Flag-AC5 with an anti-Flag antibody and KCTD1-mVenus with an anti-GFP antibody. Representative blot from three independent experiments. (C) Scheme of dual luminescence assay to measure Ubiquitin associated with Flag-AC5 following anti-Flag pulldown. Proteasome inhibition was achieved by overnight treatment of cells with MG132 (10 μM). (D) Quantification of luminescence ratio (Fluc/Nluc) from anti-Flag IP from Flag-AC5-WT-Nluc lysates. n = 5 biological replicates, One-way ANOVA: F = 15.02, R2 = 0.7379 (****P < 0.0001). The average ratio in the presence of KCTD1 (red dotted line) or the absence of KCTD1 (black dotted line) is indicated. (E) Quantification of luminescence ratio (Fluc/Nluc) from anti-Flag IP from Flag-AC5-NQ-Nluc lysates. n = 5 biological replicates, One-way ANOVA: F = 2.666, R2 = 0.3333 (P = 0.0830). The average ratio from Flag-AC5-WT-Nluc in the presence of KCTD1 (red dotted line) or the absence of KCTD1 (black dotted line) is indicated. (F) Model based on our data that AC5 degradation is promoted by glycosylation, which is influenced by KCTD1. Unless indicated, all data are represented as mean ± SE of the mean. Also, SI Appendix, Fig. S2.
Fig. 3.
Fig. 3.
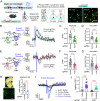
KCTD1 regulates the striatal AC5 level and forskolin-induced cAMP signaling. (A) Schematic of approach for CRISPR/SaCas9-mediated knockdown of Kctd1 in CAMPER expressing primary striatal neurons. (B) Western blot quantification from primary striatal neurons (Control or Kctd1 knockdown) for KCTD1 (n = 4), AC1 (n = 3), AC3 (n = 3), AC5 (n = 4), and AC9 (n = 3). Unpaired t test, P = 0.0005 (KCTD1), P = 0.5654 (AC1), P = 0.7391 (AC3), P = 0.0005 (AC5), and P = 0.8054 (AC9). (C) Representative images of primary striatal CAMPER neurons expressing the TEpacVV biosensor and AAV-Cre-P2A-dTomato. The white scale bar represents 50 μm. (D) Average traces of real-time cAMP response to bath application of 1 μM forskolin in Control sgRNA (n = 68 neurons) and Kctd1 sgRNA (n = 45 neurons) primary striatal CAMPER neurons. (E) Quantification of maximum cAMP response amplitude of primary striatal CAMPER neurons to 1 μM forskolin. n = 68 neurons Control sgRNA, n = 45 neurons Kctd1 sgRNA, unpaired nonparametric t test, Mann–Whitney test (U = 361), P < 0.0001. All data are represented as mean ± SE of the mean. Also, SI Appendix, Fig. S3.
Fig. 4.
Fig. 4.
KCTD1 is an essential regulator of striatal dopamine cAMP signaling. (A) Schematic of approach for CRISPR/SaCas9-mediated knockdown of Kctd1 for 2-photon FRET imaging in acute brain slices from CAMPER mice. Representative images of TEpacVV fluorescence in 300 μm acute brain slice during live imaging. White scale bar represents 50 μm. (B) Average traces of electrically evoked D1R cAMP in Control sgRNA (n = 18 neurons/six animals) and Kctd1 sgRNA (n = 21 neurons/seven animals) acute brain slices from CAMPER mice. (C) Quantification of maximum D1R cAMP response amplitude in acute brain slices from CAMPER mice following electrical stimulation. n = 18 neurons Control sgRNA (six animals), n = 21 neurons Kctd1 sgRNA (seven animals), unpaired nonparametric t test, Mann–Whitney test (U = 56), P < 0.0001. (D) Quantification of net D1R cAMP response, as calculated by area under the response curve, in acute brain slices from CAMPER mice following electrical stimulation. n = 18 neurons Control sgRNA (six animals), n = 21 neurons Kctd1 sgRNA (seven animals), unpaired nonparametric t test, Mann–Whitney test (U = 40), P < 0.0001. (E) Average traces of electrically evoked D2R cAMP in Control sgRNA (n = 34 neurons/six animals) and Kctd1 sgRNA (n = 29 neurons/seven animals) acute brain slices from CAMPER mice. (F) Quantification of maximum D2R cAMP response amplitude in acute brain slices from CAMPER mice following electrical stimulation. n = 34 neurons Control sgRNA (six animals), n = 29 neurons Kctd1 sgRNA (seven animals), unpaired nonparametric t test, Mann–Whitney test (U = 135), P < 0.0001. (G) Quantification of net D2R cAMP response, as calculated by area under the response curve, in acute brain slices from CAMPER mice following electrical stimulation. n = 34 neurons Control sgRNA (six animals), n = 29 neurons Kctd1 sgRNA (seven animals), unpaired nonparametric t test, Mann–Whitney test (U = 167.5), P < 0.0001. (H) ELISA-based quantification of cAMP from dorsal striatal tissue punches in 300 μm slices from Control sgRNA (n = 7 animals) and Kctd1 sgRNA (n = 6 animals) CAMPER mice. Unpaired nonparametric t test, Mann–Whitney test (U = 1), P = 0.0023. (I) Average traces of electrically evoked D2R cAMP in either buffer or 1 μM forskolin: Control sgRNA (buffer n = 15 neurons/seven animals, forskolin n = 24 neurons/seven animals), Kctd1 sgRNA (buffer n = 14 neurons/eight animals, forskolin n = 18 neurons/eight animals). (J) Quantification of maximum D2R cAMP response amplitude in acute brain slices from CAMPER mice following electrical stimulation. Control sgRNA (buffer n = 15 neurons/seven animals, forskolin n = 24 neurons/seven animals) unpaired nonparametric t test, Mann–Whitney test (U = 4), P < 0.0001. Kctd1 sgRNA (buffer n = 14 neurons/eight animals, forskolin n = 18 neurons/eight animals) unpaired nonparametric t test, Mann–Whitney test (U = 1), P < 0.0001. All data are represented as mean ± SE of the mean. Also, SI Appendix, Fig. S4.
Fig. 5.
Fig. 5.
Loss of KCTD1 imparts striatal circuit-specific effects on motor properties. (A) Schematic of basal ganglia circuit in motor control. (B) Schematic of approach to knockdown Kctd1 in dorsal striatal D1- and D2-MSNs via AAV injection of Cre-dependent CRISPR/SaCas9 in Drd1aCre and Adora2ACre mice, respectively. (C) Timeline of mouse behavior experiments. (D) Quantification of initial backward walking before motor learning. Drd1aCre (D1 Ctrl sgRNA, n = 14: seven male, seven female; D1 Kctd1 sgRNA, n = 13: eight male, five female) unpaired nonparametric t test, Mann–Whitney test (U = 23), P = 0.0005. Adora2ACre (D2 Ctrl sgRNA, n = 7: three male, four female; D2 Kctd1 sgRNA, n = 7: three male, four female) unpaired nonparametric t test, Mann–Whitney test (U = 23), P = 0.9015. (E) Quantification of initial hindlimb clasping scores before motor learning. Drd1aCre (D1 Ctrl sgRNA, n = 14: seven male, seven female; D1 Kctd1 sgRNA, n = 13: eight male, five female) unpaired nonparametric t test, Mann–Whitney test (U = 21), P = 0.0002. Adora2ACre (D2 Ctrl sgRNA, n = 7: three male, four female; D2 Kctd1 sgRNA, n = 7: three male, four female) unpaired nonparametric t test, Mann–Whitney test (U = 21), P > 0.9999. (F) Quantification of latency to fall trials on accelerating rotarod for D1 Ctrl sgRNA (n = 14: seven male, seven female) and D1 Kctd1 sgRNA (n = 13: eight male, five female) mice. (G, Left) Quantification of average latency to fall on the first day (Day 1) for D1 Ctrl sgRNA (n = 14: seven male, seven female) and D1 Kctd1 sgRNA (n = 13: eight male, five female). Unpaired nonparametric t test, Mann–Whitney test (U = 0), P < 0.0001. (Right) Quantification of the learning rate in D1 Ctrl sgRNA (n = 14: seven male, seven female) and D1 Kctd1 sgRNA (n = 13: eight male, five female). Unpaired nonparametric t test, Mann–Whitney test (U = 0), P < 0.0001. (H) Quantification of latency to fall trials on accelerating rotarod for D2 Ctrl sgRNA (n = 7: three male, four female) and D2 Kctd1 sgRNA (n = 7: three male, four female) mice. (I, Left) Quantification of average latency to fall on the first day (Day 1) for D2 Ctrl sgRNA (n = 7: three male, four female) and D2 Kctd1 sgRNA (n = 7: three male, four female) mice. Unpaired nonparametric t test, Mann–Whitney test (U = 1), P = 0.0012. (Right) Quantification of the learning rate in D2 Ctrl sgRNA (n = 7: three male, four female) and D2 Kctd1 sgRNA (n = 7: three male, four female) mice. Unpaired nonparametric t test, Mann–Whitney test (U = 1), P = 0.0012. All data are represented as mean ± SE of the mean. Also, SI Appendix, Fig. S5.

References

    1. Graybiel A. M., Aosaki T., Flaherty A. W., Kimura M., The basal ganglia and adaptive motor control. Science 265, 1826–1831 (1994). - PubMed
    1. Picconi B., et al. , Pathological synaptic plasticity in the striatum: Implications for Parkinson’s disease. Neurotoxicology 26, 779–783 (2005). - PubMed
    1. Wichmann T., Dostrovsky J. O., Pathological basal ganglia activity in movement disorders. Neuroscience 198, 232–244 (2011). - PMC - PubMed
    1. Brotchie J. M., Adjuncts to dopamine replacement: A pragmatic approach to reducing the problem of dyskinesia in Parkinson’s disease. Mov. Disord. 13, 871–876 (1998). - PubMed
    1. Jankovic J., Dopamine depleters in the treatment of hyperkinetic movement disorders. Expert. Opin. Pharmacother. 17, 2461–2470 (2016). - PubMed

LinkOut - more resources