. 2024 Nov 11;52(20):12727-12747.
doi: 10.1093/nar/gkae889.

Molecular basis for the transcriptional regulation of an epoxide-based virulence circuit in Pseudomonas aeruginosa

Affiliations

Molecular basis for the transcriptional regulation of an epoxide-based virulence circuit in Pseudomonas aeruginosa

Susu He et al. Nucleic Acids Res. .

Abstract

The opportunistic pathogen Pseudomonas aeruginosa infects the airways of people with cystic fibrosis (CF) and produces a virulence factor Cif that is associated with worse outcomes. Cif is an epoxide hydrolase that reduces cell-surface abundance of the cystic fibrosis transmembrane conductance regulator (CFTR) and sabotages pro-resolving signals. Its expression is regulated by a divergently transcribed TetR family transcriptional repressor. CifR represents the first reported epoxide-sensing bacterial transcriptional regulator, but neither its interaction with cognate operator sequences nor the mechanism of activation has been investigated. Using biochemical and structural approaches, we uncovered the molecular mechanisms controlling this complex virulence operon. We present here the first molecular structures of CifR alone and in complex with operator DNA, resolved in a single crystal lattice. Significant conformational changes between these two structures suggest how CifR regulates the expression of the virulence gene cif. Interactions between the N-terminal extension of CifR with the DNA minor groove of the operator play a significant role in the operator recognition of CifR. We also determined that cysteine residue Cys107 is critical for epoxide sensing and DNA release. These results offer new insights into the stereochemical regulation of an epoxide-based virulence circuit in a critically important clinical pathogen.


Figures

Graphical Abstract
Graphical Abstract
Figure 1.
Figure 1.
The cif-cifR operon and epoxide-based virulence circuit. Top row: The cif-cifR operon. The arrows show the four open reading frames in the operon. The two rectangles in grey represent the two operator sites in the repressed state bound to CifR, shown as a blue oval doublet (middle row; blue). Bottom row: Binding of CifR to an epoxide (schematic drawing) releases CifR from the DNA, activating transcription of the operon. Cif is shown as a gold oval doublet which converts the epoxide ring to a vicinal diol (schematic drawing).
Figure 2.
Figure 2.
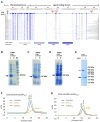
Mutagenetic stabilization of the CifR. (A) CifR protein domain organization and sequence conservation. The domain organization and experimental secondary structure derived from DSSP analysis of the crystal structure determined in this study are shown above the results of a PSI-BLAST (Position-Specific Iterative Basic Local Alignment Search Tool) analysis involving the 938 TFRs with the highest sequence similarity to CifR from the NCBI protein database. The sequences vary from 100 to 196 amino acids in length, with grey horizontal lines indicating alignment gaps. The columns of varying shades of blue under each CifR residue indicate the percent conservation of that residue among the aligned TFRs, corresponding to the degree of conservation shown in the key at the bottom. Cysteine residues are highlighted in red and Arg6 is marked in black above the CifR sequence. (B–D) Coomassie-stained SDS-PAGE gels for CifR constructs. Rosetta 2 (DE3) cells were transformed with plasmids expressing decahistidine-tagged WT CifRCCC (B), CifRTCC (C) and CifRTCR (D) constructs, grown in LB medium, and induced with 0.5 mM IPTG overnight at 16°C. Lanes are marked ‘L’ for whole-cell lysate or ‘S’ for supernatant clarified by centrifugation at 40 000 rpm for 1 h in a 45 Ti rotor. (E) SDS-PAGE gel of purified CifRTCR (in the absence and presence of reducing agent) following cleavage of the decahistidine tag. The positions of Mr standards are shown for each gel (adjacent lines) and the corresponding Mr values shown in (E). The short black lines on the side of the gel indicate protein standards of size 76, 52, 38, 31, 24, 17 and 12 kDa from top to bottom. The black arrows point to the expected gel migration position for CifR monomer according to the protein standards. The grey arrow points to the expected gel migration position for CifR dimer. (F, G) Size-exclusion chromatography elution profiles of protein, DNA, and protein:DNA complex using cifR-prox dsDNA36 (F) and cifR-prox dsDNA26L (G). In each case, the retention times of CifRTCR are consistent with the predicted molecular mass of a protein dimer (40–43 kDa). The elution profile of the CifRTCR:dsDNA26L complex yielded an estimate (64 kDa) close to that expected for a single dimer bound to the operator. In contrast, the elution profile of the CifRTCR:dsDNA36 complex yielded a significantly higher molecular mass estimate (100 kDa), with a value close to that expected for a complex formed by two CifR dimers bound to a single operator (109 kDa). The dsDNA36 eluted at a volume corresponding to 60 kDa, compared to a calculated molecular mass of 23 kDa. The earlier retention time is likely due to the elongated nature of DNA, since SEC retention time depends on hydrodynamic radius, which is shape dependent. Calibration standards are globular proteins, and the extended nature of the DNA double helix can thus confound molecular mass determination (see also Table 2).
Figure 3.
Figure 3.
DNA screening for CifRTCR:DNA complex formation and crystallization. (A) Sequences of the DNA oligonucleotides tested for optimizing the CifRTCR:DNA complex formation. Varying sequence lengths of the cifR-proximal operator DNA (2nd row) were assessed for CifRTCR:DNA complex formation and co-crystallization. The sequence highlighted in grey represents the minimal length of DNA (23 bp) which could bind to CifR in this study. Cohesive bases are highlighted in red. Sequence alignment of the cifR-proximal and the morB-proximal operator (Top row) is shown. The two operators present in an inverted orientation in the genome of P. aeruginosa. The orientation of the strands labeled with 5′ to 3′ correspond to the top strand in Figure 1A. (B) EMSAs of CifRTCR with each of the oligonucleotides listed in (A). The concentration of DNA in the assay was 2 μM. ‘P:D ratio’ is the molar ratio of CifR monomer to DNA. ‘P-D’ and ‘DNA’ indicate the migration positions of protein:DNA complex and free DNA, respectively. This shorthand is used throughout the article. (C) Representative crystallization screening results for each complex assayed in (B). Each picture shows the crystal morphology with the best diffraction, or the most common result observed during the screening process. ND, not determined.
Figure 4.
Figure 4.
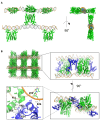
Lattice packing of the CifRTCR:dsDNA26L complex and apo-CifRTCR crystal. (A) Lattice formation by DNA- and protein-protein interactions. DNA duplexes (orange/grey) align end-to-end to form extended helices, with each DNA molecule bound by one CifRTCR dimer (green ribbons). The DNA duplexes in the center are shown in grey to distinguish the DNA-DNA junctions. A 90° rotation about the indicated axis reveals the protein-protein contacts that join neighboring DNA helical extensions in the lattice (right). (B) Apo-CifRTCR is caged into the bulk solvent channel of the lattice formed by CifRTCR:dsDNA26L. The panel on the top left shows the bulk solvent channels formed by the CifRTCR:dsDNA26L complex. The inset on the top right shows a closeup view of the apo-CifRTCR dimers (blue ribbons), which are omitted in the previous panels. The inset on the bottom right shows the 90° rotation view of the inset on the top right. The inset on the bottom left shows the close up view of lattice contacts between the apo-CifRTCR and CifRTCR:dsDNA26L complex. Residues with polar contacts are shown as sticks.
Figure 5.
Figure 5.
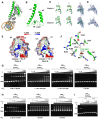
Structural analysis of the CifRTCR:dsDNA26L complex. (A) Overall structure of the CifRTCR:dsDNA26L complex. CifRTCR contacts the DNA duplex (orange) through the DNA-binding domain (DBD, green ribbon), while the ligand-binding domain (LBD, pale cyan ribbon) is distal to the protein:DNA interface. The nine helices that make up the bulk of the CifRTCR structure are labeled for one protomer. The distance between the two Pro45 residues in CifR dimer is shown. (B and C) Protein:DNA contact interfaces in the major groove. (B) Leu33, Tyr48, and Lys54 (green sticks) form hydrogen bonds (grey dashes) with backbone atoms of dG16’, dA17’ (orange sticks). (C) Pro44 and Pro45 (green sticks) insert into the major groove forming van de Waals interaction (grey radical lines) with dT8 and dT18’ (orange sticks). (D) Protein:DNA contact interface in the minor groove. Arg6 (green sticks) inserts into the DNA minor groove and forms hydrogen bonds (grey dashes) with several DNA bases (dT4, dT5, dT6, dA23’, orange sticks). (E) Surface electrostatic potential prediction for the CifRTCR protein. The CifRTCR model was extracted from the DNA-bound CifRTCR complex structure and used for an APBS calculation. Red color indicates negative potential, while blue color indicates positive potential. The bottom view of the DNA-binding surface of CifRTCR is shown. An overall positive potential (blue; scale at bottom) complements the net negative potential on the DNA backbone, with a concentration of positive potential towards the periphery of the binding site. (F) Schematic of CifRTCR:DNA interactions. The central dotted black line indicates the two-fold symmetry axis of the CifR dimer. Solid lines indicate polar interactions with DNA bases (red) or with the DNA backbone or a water molecule (black). Grey dotted lines indicate van der Waals interactions. Blue shadows, areas with an enlarged DNA major groove (1 Å displacement toward protein) and orange shadows, areas with a narrowed DNA minor groove (1 Å displacement away from protein) indicated by x3DNA. (G) Functional analysis of protein:DNA contacts by EMSA. The DNA concentration was 0.5 μM. Protein monomer concentrations tested were 0, 0.1, 0.2, 0.4, 0.8, 1, 1.6, 2, 4, and 10 μM. Duplex dsDNA26LT4G has mutations at dT4 and dA23. Duplex dsDNA26L4-mix has mutations of dC15dT, dA16dC, dC17dT and dT18dG (see Supplementary Table S1). CifRTCRR6A: CifRTCR with mutation of arginine to alanine at amino acid residue 6; CifRTCR11–196: CifRTCR lacking residues 1–10. Binding affinity is shown as EC50.
Figure 6.
Figure 6.
Comparison of DNA-bound CifRTCR and apo-CifRTCR structures. (A) Overall structure of apo-CifRTCR. The structure of apo-CifRTCR is shown as blue ribbons. Unresolved apo residues 96–118 are shown as dotted line. The distance between the two Pro45 residues in the CifR dimer is shown. (B) Superposition of the CifRTCR:dsDNA26L complex and the apo-CifRTCR dimer. Cα/no outlier least-squares superposition of apo-CifRTCR (blue ribbons) and DNA-bound CifRTR (green ribbons; orange DNA) performed in PyMol results in an RMSD of 6.9 Å. (C) Superposition of CifRTCR:dsDNA26L complex and apo-CifRTCR aligned at the ligand-binding domain of one protomer. A 90° rotation of the view in (B) results in the view shown here. Only one protomer is shown for clarity. (D) Conformational change of helix α4. Alignment of apo-CifRTCR and DNA-bound CifRTCR using the DNA-binding domain of one protomer of each dimer reveals the conformational change of helix α4 upon DNA binding. Only helices α1-α4 are shown for clarity. (E). Superposition of the ligand-binding domains of CifRTCR in the presence and absence of DNA. Helices α5–α7 of CifRTCR:dsDNA26L complex and helices α5 and α7 of apo-CifRTCR are shown. Residues 96 through 118 including the region spanning helix α6 were poorly resolved and were therefore left unmodeled in the apo structure (blue dashed line). (F) Conformational change of helix α6. The 2mFO-DFC map (blue mesh) contoured at 1 σ and the mFO-DFC map (green mesh for positive peaks) contoured at 1.5 σ for the helices α5–α7 of apo-CifRTCR are shown with structural models superimposed. Apo-CifRTCR is shown as a blue ribbon, revealing the structure flanking each side of the unmodeled helix α6. DNA-bound CifRTCR is shown as a green ribbon, with helix α6 highlighted in red.
Figure 7.
Figure 7.
The role of conserved residue Cys107 in the potential epoxide-binding pocket. (A) The potential epoxide-binding pocket in CifRTCR. Only one CifRTCR protomer is shown in the CifRTCR:dsDNA26L structure for clearer view of the potential epoxide-binding pocket formed by helices α5 - α7 (green); other helices are shown in grey. (B) A closeup view of the proposed epoxide-binding pocket. Cys107 lies at the bottom of the epoxide-binding pocket (shown as stick). (C) Cys107 modification in the crystal of CifRTCR:dsDNA26L complex. Top row, chain A. Bottom row, chain B. Panel i and ii, mFo-DFc map shown as green mesh contoured at 3σ when modeling the residue at position 107. Panel i is modeled with cysteine for both chains. Panel ii is modeled with sulfenic acid (CSO) for Chain A and sulfinic acid (CSD) for chain B at position 107 to check model compatibility with the observed positive density peaks. Panel iii: electron density maps were calculated from refined coordinates containing aforementioned cysteine modifications. A 2mFo-DFc map (blue mesh) contoured at 1.5σ and an mFo-DFc map (green mesh) contoured at 3σ are shown. No 3σ sigma negative density peaks are observed. (D) Electron density map of CifRTSR:dsDNA26L at residue 107. A 2mFo-DFc map is shown as blue mesh contoured at 1.5σ. An mFo-DFc map contoured at 3σ is shown as green mesh. (E) Putative ligand-binding cavity in CifRTCR:dsDNA26L (blue surface; marked by a black oval) with positive potential that is not visible from the outside and that is surrounded by helices a5- a7 (green ribbons). A modified version of 6NSN coordinates, with CSO and CSD modified to cysteines was used for the volume estimation of the ligand-binding pocket. The volume of the pocket was analyzed using CastP (53). Cys107 is shown as a stick model. (F) Comparison of the ligand-binding pockets of CifRTCR:dsDNA26L and CifRTSR:dsDNA26L. DNA-bound CifRTCR (green sticks) and DNA-bound CifRTSR (white sticks) were aligned using the ligand-binding domains. (G) The role of residue Cys107 of CifR on DNA binding. DNA binding affinity of cysteine mutants was assayed by EMSA. DNA, 0.5 μM. CifR mutants were titrated at concentrations of 0, 0.1, 0.2, 0.4, 0.8, 1.0, 1.6, 2.0, 4.0 and 10.0 μM. (H) Response of the CifR cysteine mutants to ligand. The involvement of Cys107 in ligand recognition and/or transduction of ligand binding to DNA release was assessed by EMSA with CifRTCR, CifRTSR and CifRCSC mutants. DNA, 0.5 μM. Protein, 4 μM. (I) Response of CifRTCR protein to cysteine covalent modifier NEM or epoxide EBH analyzed by EMSA. A mixture containing 0.5 μM DNA and 1 μM CifRTCR was titrated with 0.5, 1, 2 and 4 mM EBH or the cysteine-modifying compound NEM. Cpd = compound.
Figure 8.
Figure 8.
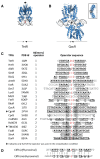
Recognition of operator DNAs by TFRs. (A, B) Proteins are shown as blue ribbons. DNA is shown in black and grey for each strand of the DNA duplex. The solid ovals indicate the two-fold rotational symmetry with the dotted lines indicating the orientation of the axes. The arrows below indicate the inverted repeats of DNA. (A) Structure of DNA-bound TetR. The center of the DNA is shown in red. (B) Structure of DNA-bound QacR. The rotation axis is perpendicular to the plane of view. The inset shows a 90°-rotated view of the main panel. (C) Operator DNA sequences of 21 TFRs with known DNA-complexed structure. The operator DNA sequences analyzed here are those used in the protein:DNA complex structure determination. The predicted center of each inverted repeat is shown with red text or bars. Structures in which only half of the operator DNA was used in the crystallization are labeled with an asterisk. The bases with potential inverted repeats property are underlined and in bold. The centers for two embedded repeats are highlighted in grey. The embedded repeats are shown in detail in Figure S10. (D) Operator DNA sequences of CifR. The bases with potential inverted repeats property are underlined and in bold. The conserved residues between the two operator DNA sequence are marked by vertical alignment bars (black).

Update of

References

    1. Moradali M.F., Ghods S., Rehm B.H.. Pseudomonas aeruginosa lifestyle: a paradigm for adaptation, survival, and persistence. Front. Cell. Infect. Microbiol. 2017; 7:39. - PMC - PubMed
    1. Patel I.S., Seemungal T.A., Wilks M., Lloyd-Owen S.J., Donaldson G.C., Wedzicha J.A.. Relationship between bacterial colonisation and the frequency, character, and severity of COPD exacerbations. Thorax. 2002; 57:759–764. - PMC - PubMed
    1. Groenewegen K.H., Wouters E.F.. Bacterial infections in patients requiring admission for an acute exacerbation of COPD; a 1-year prospective study. Respir. Med. 2003; 97:770–777. - PubMed
    1. Wang H., Ji X.B., Mao B., Li C.W., Lu H.W., Xu J.F.. Pseudomonas aeruginosa isolation in patients with non-cystic fibrosis bronchiectasis: a retrospective study. BMJ Open. 2018; 8:e014613. - PMC - PubMed
    1. Finch S., McDonnell M.J., Abo-Leyah H., Aliberti S., Chalmers J.D.. A comprehensive analysis of the impact of Pseudomonas aeruginosa colonization on prognosis in adult bronchiectasis. Ann Am Thorac Soc. 2015; 12:1602–1611. - PubMed

MeSH terms

LinkOut - more resources