Review
. 2024 Oct 18;10(42):eadn9698.
doi: 10.1126/sciadv.adn9698. Epub 2024 Oct 16.

Feeding global aquaculture

Affiliations
Review

Feeding global aquaculture

Spencer Roberts et al. Sci Adv. .

Abstract

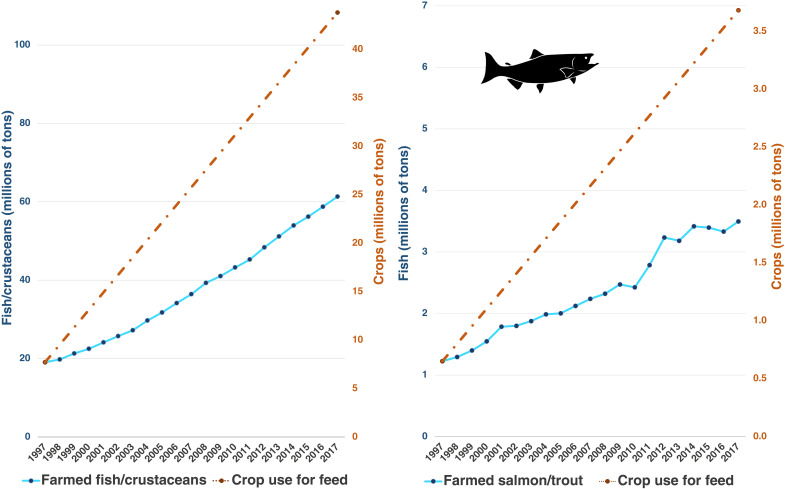
The growth of animal aquaculture requires ever more feed. Yet, fish and crustacean farming is argued to be sustainable because wild fish use is low and has improved over time. Here, accounting for trimmings and by-products from wild fish in aquaculture feed, and using four different sources of industry-reported feed composition data, we find ratios of fish inputs to farmed outputs of 0.36 to 1.15-27 to 307% higher than a previous estimate of 0.28. Furthermore, a metric that incorporates wild fish mortality during capture and excludes unfed systems raises the wild fish mortality-to-farmed fish output ratio to 0.57 to 1.78. We also evaluate terrestrial ingredients in aquaculture feeds. Widely cited estimates of declines in wild fish use from 1997 to 2017 entailed a trade-off of more than fivefold increase in feed crops over the same period. Our assessment challenges the sustainability of fed aquaculture and its role in food security.


Figures

Fig. 1.
Fig. 1.. Estimated ratios of wild fish biomass inputs to farmed fish biomass outputs (FI:FO) for global aquaculture across five different datasets and two different methods.
Naylor&al uses methods of Naylor et al. (14). Naylor&al* uses alternative efficiency rates of fish meal and oil processing, assumptions regarding processing waste, and allocations of wild fish cuts. The other datasets differ by meal and oil inclusion rates in feed, and for MBA, the percent of each from by-products. Data were selected as close to 2017 as available. Sources are Naylor et al. (14), Tacon et al. (15), Monterey Bay Aquarium Seafood Watch (–25), and Pahlow et al. (26).
Fig. 2.
Fig. 2.. Calculation of wild fish use efficiency in aquaculture by five different mathematical methods using four different sources of feed composition data.
Naylor&al shows the results using methods of Naylor et al. (14). Adjusted methods calculate reduction efficiencies using species composition of reported catch, account for losses of fish oil in processing, and include trimmings and by-products from wild fish. Collateral methods additionally include bycatch. The two rightmost column groupings exclude production from unfed farms. Feed composition data sources are Naylor et al. (14), Tacon et al. (15), Monterey Bay Aquarium Seafood Watch (–25), and Pahlow et al. (26).
Fig. 3.
Fig. 3.. Biomass ratios of wild fish mortality to farmed fish product (FI:FO) for salmon farming, delineated by cause and repeated using four different datasets.
The leftmost column represents results of the FI:FO formula outlined by RW Hardy and used in Naylor et al. (14). Fish inputs not captured by this method are included in Naylor&al* and subsequent scenarios. Cuts represent previously unaccounted wild fish classified as trimmings and by-products. Collateral represents mortality from bycatch and slipping during capture. Sources are Naylor et al. (14), Tacon et al. (15), Monterey Bay Aquarium Seafood Watch (–25), and Pahlow et al. (26).
Fig. 4.
Fig. 4.. Aquaculture feed composition across four scenarios.
Divisions within blue wedges represent proportions of fish meal and oil. Orange wedges without divisions represent datasets without information on the types and proportions of crops used. Sources are Naylor et al. (14), Tacon et al. (15), Monterey Bay Aquarium Seafood Watch (–25), and Pahlow et al. (26).
Fig. 5.
Fig. 5.. Fish extraction and land use trade-off in aquaculture.
Circle sizes represent the total production weight of each farmed species group by reported production for the year 2015. Terrestrial impacts are calculated by multiplying feed use data from Pahlow et al. (26) by land use data from Poore and Nemecek (44). Fishing impacts are assessed as a ratio of fished biomass input over farmed fish biomass output (FI:FO), calculated using our adjusted FI:FO method and Pahlow et al. (26) feed composition data.
Fig. 6.
Fig. 6.. Crop use for aquaculture feed over time.
Blue lines indicated reported production for all farmed fish and crustacean species groups combined in the left panel and for salmon and trout in the right panel. Orange trend lines indicate the increase in crop feed requirements calculated using 1997 and 2017 data on feed composition and FCR by species group from Naylor et al. (14).

References

    1. Alder J., Campbell B., Karpouzi V., Kaschner K., Pauly D., Forage fish: From ecosystems to markets. Annu. Rev. Env. Resour. 33, 153–166 (2008).
    1. Tacon A. G. J., Metian M., Fishing for aquaculture: Non-food use of small pelagic forage fish—A global perspective. Rev. Fish. Sci. 17, 305–317 (2009).
    1. Cashion T., The end use of marine fisheries landings. Fish. Cent. Res. Rep. 24, 108 (2016).
    1. Sarker P. K., Microorganisms in fish feeds, technological innovations, and key strategies for sustainable aquaculture. Microorganisms 11, 439 (2023). - PMC - PubMed
    1. Cashion T., Tyedmers P., Parker R. W. R., Global reduction fisheries and their products in the context of sustainable limits. Fish Fish. 18, 1026–1037 (2017).

Publication types

LinkOut - more resources