

To what extent did mortality from COVID-19 in England and Wales differ for migrants compared to non-migrants in 2020 and 2021? A descriptive, observational study
- PMID: 39413439
- PMCID: PMC11631530
- DOI: 10.1093/eurpub/ckae142
To what extent did mortality from COVID-19 in England and Wales differ for migrants compared to non-migrants in 2020 and 2021? A descriptive, observational study
Abstract
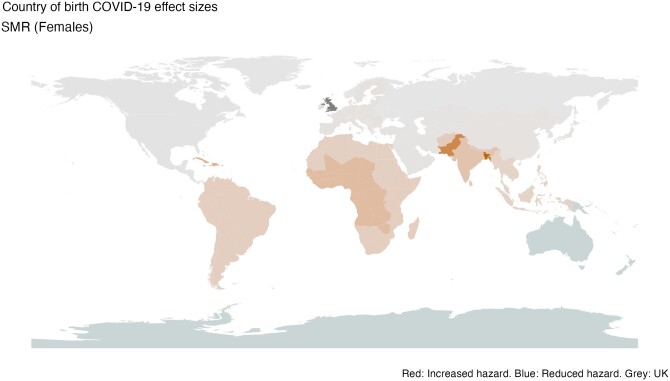
Seventeen percent of people living in the UK are migrants. In high-income countries, migrants have been shown to have better all-cause mortality but worse mortality for some specific causes such as infectious diseases. This observational study aims to quantify the extent to which mortality from coronavirus disease 2019 (COVID-19) differed between migrants and non-migrants for the population of England and Wales, 2020-2021. We use Official National Statistics data to compare mortality from COVID-19 in 2020 and 2021 by country/region of birth, expressed as the standardized mortality ratio with those born in England and Wales as the reference population. Migrants from 17 of 19 countries/regions examined had higher mortality from COVID-19 than non-migrants. The highest mortality was those born in Bangladesh (females SMR = 3.39, 95% CIs 3.09-3.71; males 4.41, 95% CIs 4.09-4.75); Pakistan (females 2.73, 95% CIs 2.59-2.89; males 3.02, 95% CIs 2.89-3.14); and the Caribbean (females 2.03, 95% CIs 1.87-2.20; males 2.48, 95% CIs 2.37-2.60). Migrants born in Antarctica and Oceania (females 0.54, 95% CI 0.42-0.40; males 0.71, 95% CI 0.51-0.88), and North and Central America (females 0.95, 95% CI 0.80-1.11; males 0.85, 95% CI 0.72-0.99) had lower mortality than non-migrants. Most migrant populations had higher mortality from COVID-19 than non-migrants in England and Wales. Policy-makers must work to integrate migration status into routine data collection to inform future research and understand the causes of the inequalities seen.
© The Author(s) 2024. Published by Oxford University Press on behalf of the European Public Health Association.
Figures


References
-
- European Observatory on Health Systems and Policies, McKee M. Drawing Light from the Pandemic: A New Strategy for Health and Sustainable Development: A Review of the Evidence. World Health Organization. Regional Office for Europe, 2021.
-
- Kósa K, Adány R. Studying vulnerable populations: lessons from the Roma minority. Epidemiology 2007;18:290–9. - PubMed
-
- Hiam L, Steele S, McKee M. Creating a ‘hostile environment for migrants’: the British government’s use of health service data to restrict immigration is a very bad idea. Health Econ Policy Law 2018;13:107–17. - PubMed
Publication types
MeSH terms
Grants and funding
LinkOut - more resources
Full Text Sources
Medical
