. 2024 Oct 15;5(10):101788.
doi: 10.1016/j.xcrm.2024.101788.

The μ-opioid receptor differentiates two distinct human nociceptive populations relevant to clinical pain

Affiliations

The μ-opioid receptor differentiates two distinct human nociceptive populations relevant to clinical pain

Ellen S Staedtler et al. Cell Rep Med. .

Abstract

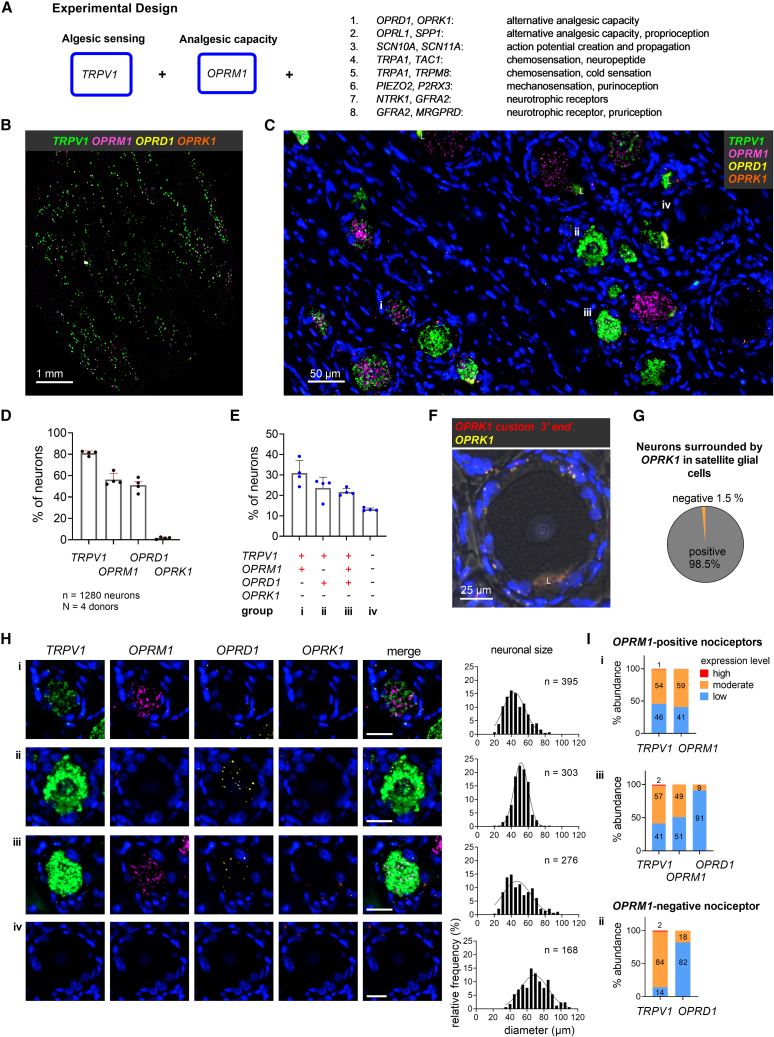
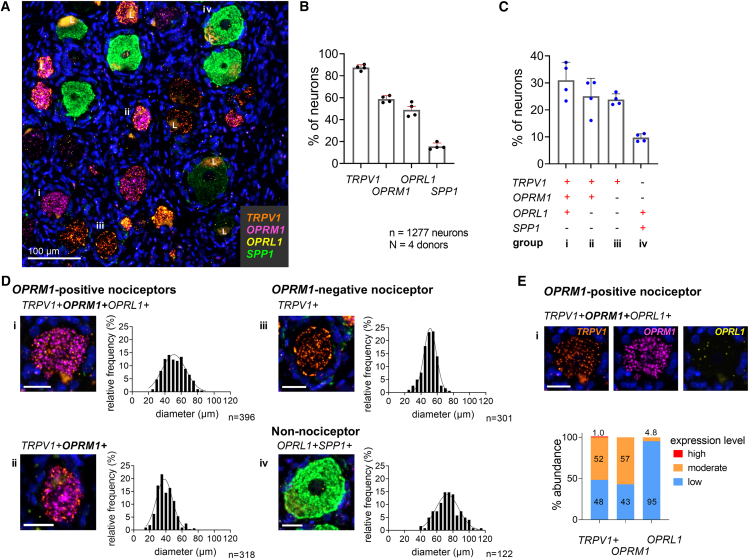
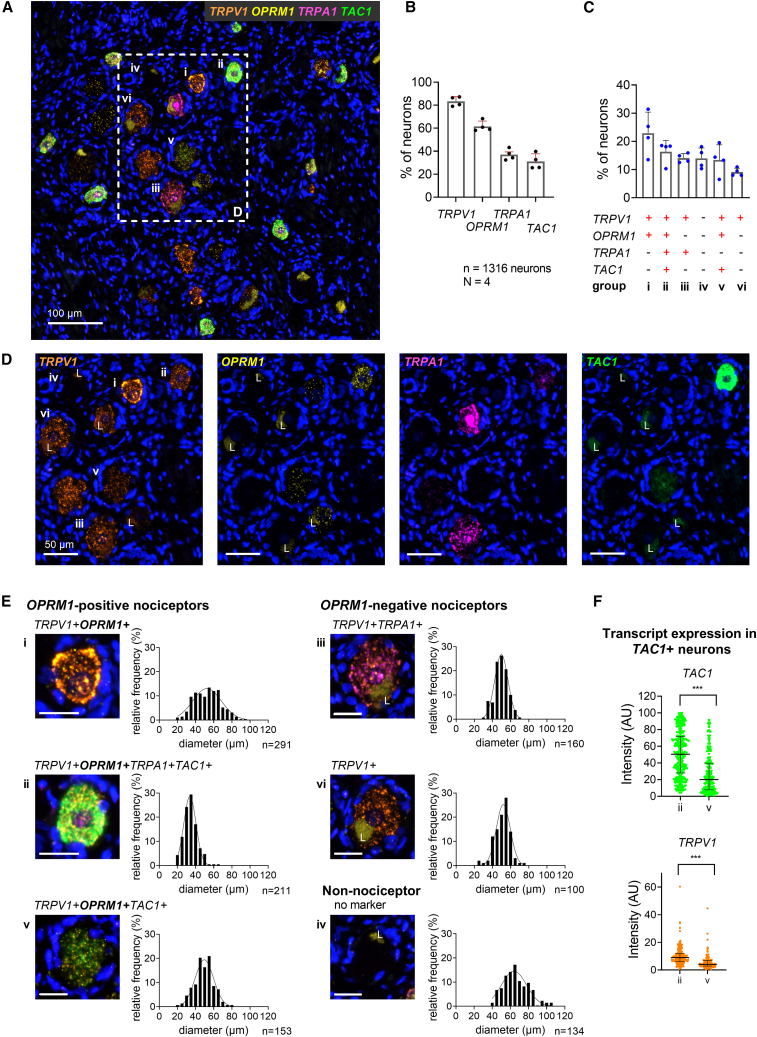
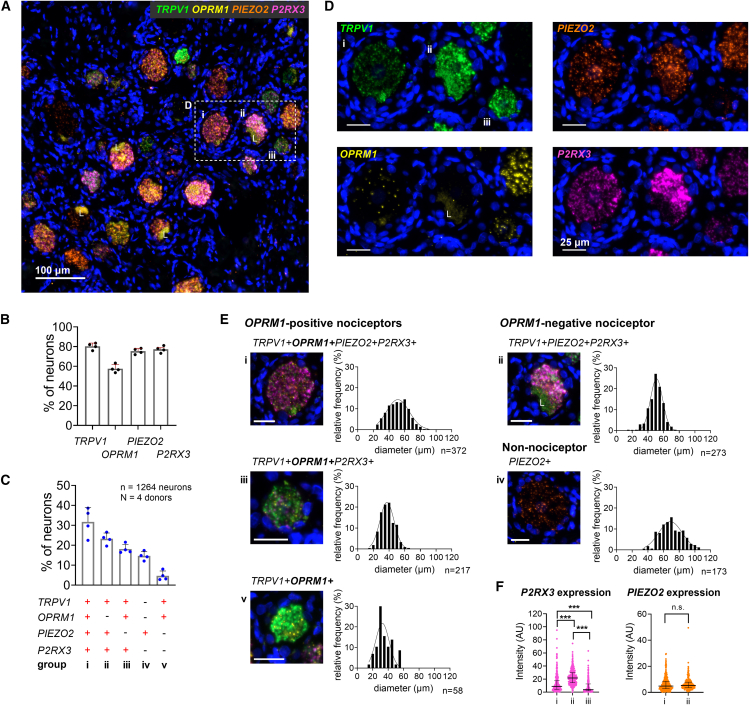
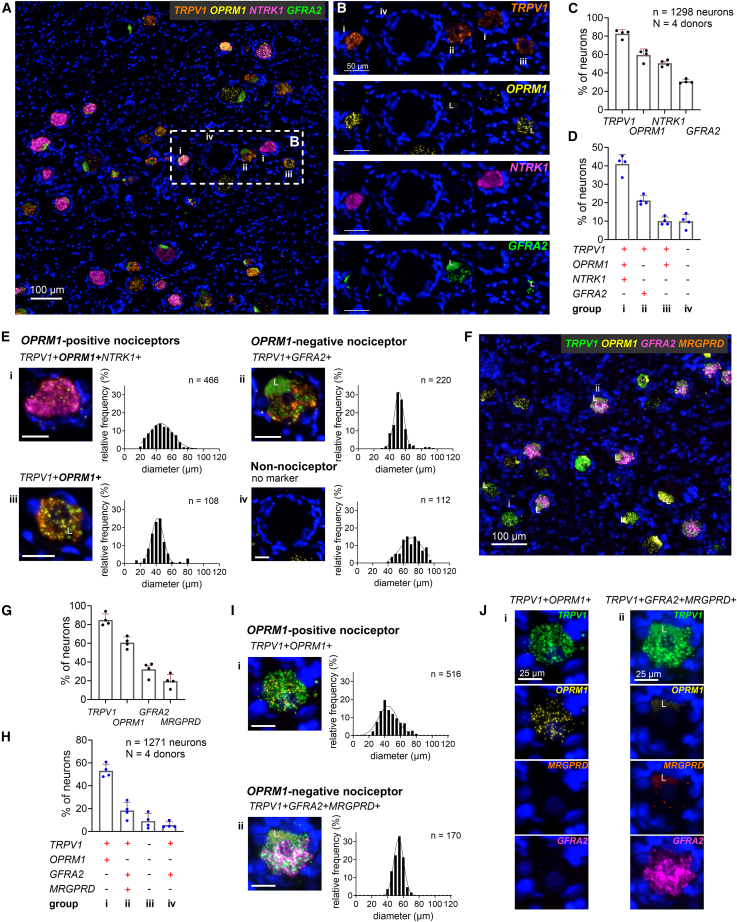
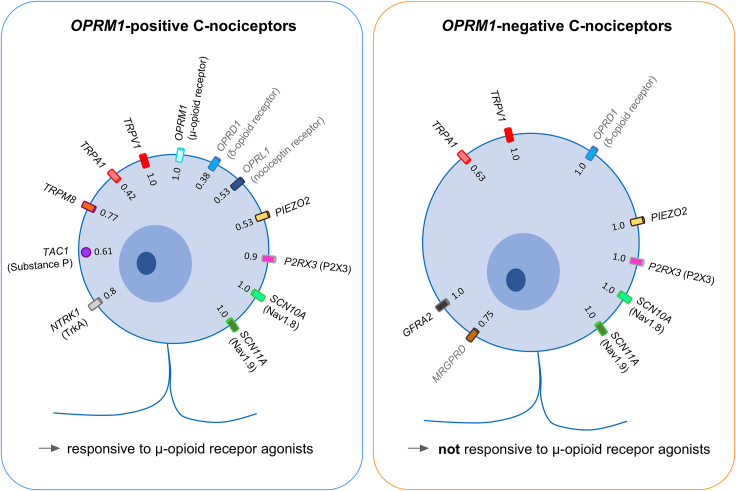
The shortfall in new analgesic agents is a major impediment to reducing reliance on opioid medications for control of severe pain. In both animals and man, attenuating nociceptive transmission from primary afferent neurons with a μ-opioid receptor agonist yields highly effective analgesia. Consequently, deeper molecular characterization of human nociceptive afferents expressing OPRM1, the μ-opioid receptor gene, is a key component for advancing analgesic drug discovery and understanding clinical pain control. A co-expression matrix for the μ-opioid receptor and a variety of nociceptive channels as well as δ- and κ-opioid receptors is established by multiplex in situ hybridization. Our results indicate an OPRM1-positive population with strong molecular resemblance to rodent peptidergic C-nociceptors associated with tissue damage pain and an OPRM1-negative population sharing molecular characteristics of murine non-peptidergic C-nociceptors. The empirical identification of two distinct human nociceptive populations that differ profoundly in their presumed responsiveness to opioids provides an actionable translational framework for human pain control.

Keywords: MRGPRD; TRPA1; TRPV1; human nociception; neuropathic pain; non-opioid analgesics; sodium channels; somatosensory afferent neurons; translational research; μ-opioid receptor.


Conflict of interest statement

Declaration of interests A.G. is an employee and shareholder of AnaBios Corp.

Figures

None
Graphical abstract
Figure 1
Figure 1
OPRM1-positive and OPRM1-negative human nociceptors express OPRD1 while OPRK1 is expressed in satellite glial cells (A) Overall schematic of experimental design for 4-Plex in situ hybridization studies. The major nociceptive ion channel TRPV1 is paired with the major analgesic receptor (μ-opioid, OPRM1) and a series of genes coding for algesic and analgesic mediators. (B) Scanned image of a complete section from human L3 DRG hybridized for the heat- and inflammation-activated channel TRPV1 (green), the μ-opioid (OPRM1) (magenta), δ-opioid (OPRD1) (yellow), and κ-opioid receptor (OPRK1) (orange). Note the strong expression and high prevalence of neuronal TRPV1 expression which tends to obscure the signal from the other genes at this magnification. (C) Enlargement showing the multiple neuronal signals. Representative neurons are labeled i–iv and are characterized further in (H). (D) Percentage of 1,280 DRG neurons expressing each individual transcript. Note the comparatively low neuronal expression of OPRK1. (E) Percentage of DRG neurons expressing the most common transcript combinations, which defines populations i–iv. Bar graphs in (D) and (E) show mean, standard deviation (SD), and individual values from four independent tissue donors. (F) Single-neuron example demonstrating the expression of OPRK1 in satellite glial cells surrounding the neuron, as detected by the standard probe (yellow) and, as a technical replicate, the custom probe (red). The large fluorescent patch, “L,” is lipofuscin. See also Figures S4 and S5. (G) The preponderance of neurons that are surrounded by OPRK1 (κ-opioid receptor) expressing satellite cells. (H) Individual channel and multi-channel microscopy images of representative neurons for each population (i–iv, as in C) and the corresponding populations’ cell size distribution. Scale bar, 25 μm. (I) Percentages of nociceptors showing low, medium, or high expression levels for TRPV1 and each opioid receptor transcript averaged across the 4 tissue donors.
Figure 2
Figure 2
OPRL1 is expressed by proprioceptors and a subpopulation of OPRM1-positive nociceptors (A) Representative section of human DRG showing positive transcripts for TRPV1, the μ-opioid receptor (OPRM1), the opioid-related nociceptin receptor 1 (OPRL1), and osteopontin (SPP1), a marker for proprioceptive neurons. Lipofuscin is marked with an “L.” (B) Percentage of somatosensory neurons expressing each individual transcript. (C) Percentage of 1,277 neurons expressing the most prevalent transcript combinations. Bar graphs in (B) and (C) show mean, SD, and individual values from four independent donors. (D) Multi-channel microscopy images of a representative individual neuron from each population and the population’s cell size distribution. OPRL1 is expressed at a low level in the neurons illustrated in i and iv. The typical OPRL1 hybridization signal can be seen in (E). (E) Single-channel images of neuron shown in (Di). Categorized expression levels for each transcript of the TRPV1+OPRM1+OPRL1+ population averaged across 4 independent tissue donors. Scale bars in (D) and (E) represent 25 μm.
Figure 3
Figure 3
The genes encoding NaV1.8 and NaV1.9 show different expression levels in OPRM1-positive and OPRM1-negative nociceptors (A) Representative section of human DRG showing neurons positive for TRPV1, the μ-opioid receptor (OPRM1), and voltage-gated sodium channels NaV1.8 (SCN10A) and NaV1.9 (SCN11A) transcripts. Representative neurons characterized further in (E) and (F) are labeled with small Roman numerals. (B) Enlarged field outlined in (A) showing each individual transcript. Overlap of all four transcripts occurs in a substantial subpopulation (i). Lipofuscin is marked with an “L.” (C) Percentage of 1,310 neurons expressing each individual transcript. (D) Percentage of neurons expressing the most common transcript combinations. Bar graphs in (C) and (D) show mean, SD, and individual values from four independent donors. (E) Multi-channel microscopy images of a representative individual neuron of each population and the population’s cell size distribution. Scale bars, 25 μm. (F) Expression intensity of individual transcripts in OPRM1-positive (i) as compared to OPRM1-negative (ii) nociceptors. Transcript levels for TRPV1 and SCN11A were significantly higher in the OPRM1-negative population. Median and interquartile range indicated. p < 0.001, Mann-Whitney U test.
Figure 4
Figure 4
TAC1 (substance P) is expressed in subpopulations of OPRM1-positive nociceptors (A) Representative section of human DRG showing neurons expressing transcripts for TRPV1, the μ-opioid receptor (OPRM1), the chemo-sensitive receptor TRPA1, and substance P precursor (TAC1). (B) Percentage of 1,316 neurons expressing each individual transcript. (C) Percentage of neurons expressing the most common transcript combinations. Bar graphs in (B) and (C) show mean, SD, and individual values from four independent donors. (D) Enlarged field shown in (A) for each individual transcript. (E) Multi-channel microscopy images of a representative individual neuron of each population and the population’s cell size distribution. Scale bars, 25 μm. Lipofuscin is marked with an “L.” (F) Expression intensity for TAC1 and TRPV1 in populations ii and v. The quad+ population ii shows significantly higher expression of TAC1 and TRPV1 and is polyresponsive to algesic mediators. Median and interquartile range indicated. p < 0.001, Mann-Whitney U test.
Figure 5
Figure 5
Expression levels of P2RX3 differ between OPRM1-positive and OPRM1-negative nociceptors (A) Representative section of human DRG showing neurons expressing transcripts for TRPV1, the μ-opioid receptor (OPRM1), the mechano-sensitive receptor PIEZO2, and the purinergic ATP receptor P2X3 (P2RX3). (B) Percentage of 1,264 neurons expressing each individual transcript. (C) Percentage of neurons expressing the most common transcript combinations. Group iv expresses PIEZO2 only and very likely represents a population of proprioceptors as shown in Figure 2Div. Bar graphs in (B) and (C) show mean, SD, and individual values from four independent donors. (D) Enlarged field shown in (A) for each individual transcript. (E) Multi-channel microscopy images of a representative individual neuron of each population and the corresponding population’s cell size distribution. Scale bars, 25 μm. Lipofuscin is marked with an “L.” (F) Expression intensities of P2RX3 and PIEZO2 in nociceptive populations. Both transcripts are expressed in OPRM1-positive and -negative nociceptors. While the expression level of PIEZO2 is similar between both populations, P2RX3 shows the highest expression in OPRM1-negative nociceptors. Median and interquartile range indicated. p < 0.001, Mann-Whitney U test, after Bonferroni correction.
Figure 6
Figure 6
Expression of transcripts for neurotrophic and MRGPRD receptors differentiates OPRM1-positive and OPRM1-negative human nociceptors (A) Representative section of human DRG showing neurons expressing transcripts for TRPV1, the μ-opioid receptor (OPRM1), and the neurotrophic receptors TrkA (NTRK1) and GFRA2. (B) Enlarged window as shown in (A) for each marker individually. (C) Percentage of 1,298 neurons expressing each individual transcript. (D) Percentage of neurons expressing the most common transcript combinations. NTRK1 and GFRA2 differentiate OPRM1-positive and -negative nociceptors. Bar graphs in (C) and (D) show mean, SD, and individual values from four independent donors. (E) Multi-channel microscopy images of a representative individual neuron of each population and the population’s cell size distribution. Scale bars, 25 μm. (F) Representative section of human DRG showing positive transcripts for TRPV1, the μ-opioid receptor (OPRM1), the neurotrophic receptor GFRA2, and the pruritogenic receptor MRGPRD. (G) Percentage of neurons showing transcripts for each marker individually. (H) Percentage of neurons expressing the most common molecular marker combinations. Bar graphs in (G) and (H) show mean, SD, and individual values from each donor. (I) Multi-channel microscopy images of a representative individual neuron of populations (i) and (ii) and the corresponding cell size distributions. Scale bars, 25 μm. (J) Individual transcripts of representative neurons shown in (I). Lipofuscin is marked with an “L.”Most OPRM1-positive nociceptors are characterized by expression of NTRK1 (TrkA), while OPRM1-negative nociceptors express transcripts for the neurotrophic receptor GFRA2 and mostly the itch-related receptor MRGPRD, suggesting distinct populations of OPRM1+ “peptidergic” and OPRM1− “non-peptidergic” neurons.
Figure 7
Figure 7
Expression of transcripts for ion channels, neuropeptide, and receptors in OPRM1-positive and OPRM1-negative C-nociceptors Transcripts expressed in OPRM1-positive (left) and OPRM1-negative (right) C-nociceptors. Numbers indicate fraction of nociceptors of main populations that do express the individual transcript. Receptors/transcripts in gray indicate genes with low expression levels in the two populations as determined by in situ hybridization. OPRM1-positive nociceptors (left) are highly polymodal and likely consist of several subpopulations. In these neurons the μ-opioid receptor is the main opioid receptor with little contribution from δ-opioid or nociception receptors and nearly no contribution from the κ-opioid receptor (which we show in humans is expressed in satellite glial cells, see Figure 1F). OPRM1-negative neurons are polymodal and typically express TRPV1 and PIEZO2, indicating potential responsiveness to thermal and mechanical stimulation. Most of them express the murine superficial skin marker MRGPRD. In this population the only opioid receptor is the δ-opioid receptor, which is expressed in low levels.

References

    1. Beecher H.K. Pain: one mystery solved. Science. 1966;151:840–841. doi: 10.1126/science.151.3712.840. - DOI - PubMed
    1. Stein C., Zöllner C. Opioids and sensory nerves. Sensory Nerves. 2009:495–518. - PubMed
    1. Inturrisi C.E. Clinical Pharmacology of Opioids for Pain. Clin. J. Pain. 2002;18:S3–S13. - PubMed
    1. Eddy N.B., May E.L. The search for a better analgesic. Science. 1973;181:407–414. doi: 10.1126/science.181.4098.407. - DOI - PubMed
    1. Benyamin R., Trescot A.M., Datta S., Buenaventura R., Adlaka R., Sehgal N., Glaser S.E., Vallejo R. Opioid complications and side effects. Pain Physician. 2008;11:S105–S120. - PubMed