. 2024 Nov 18;34(22):5349-5358.e6.
doi: 10.1016/j.cub.2024.09.045. Epub 2024 Oct 16.

Pre-existing visual responses in a projection-defined dopamine population explain individual learning trajectories

Affiliations

Pre-existing visual responses in a projection-defined dopamine population explain individual learning trajectories

Alejandro Pan-Vazquez et al. Curr Biol. .

Abstract

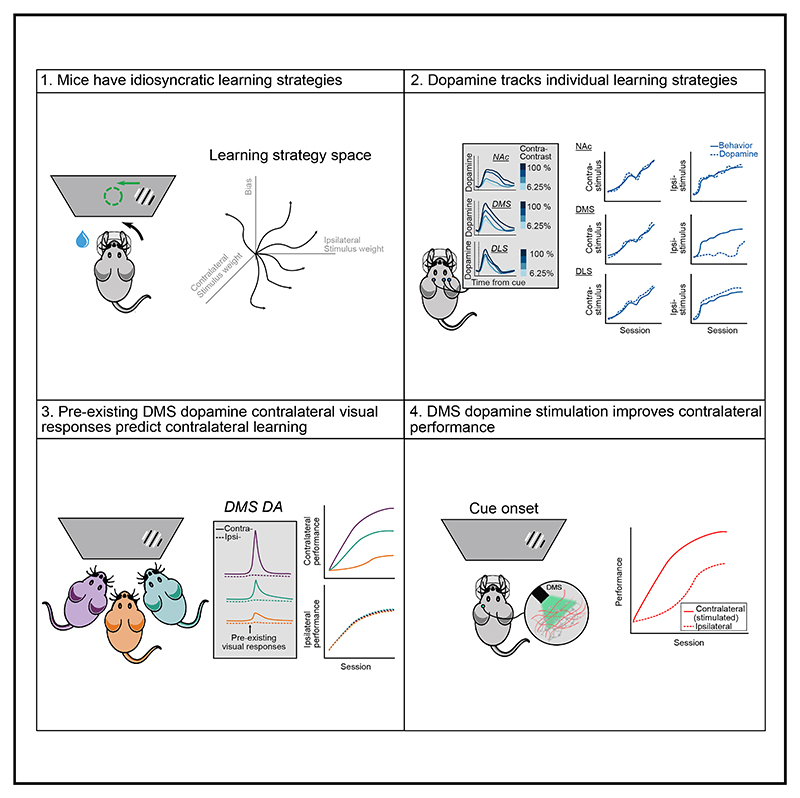
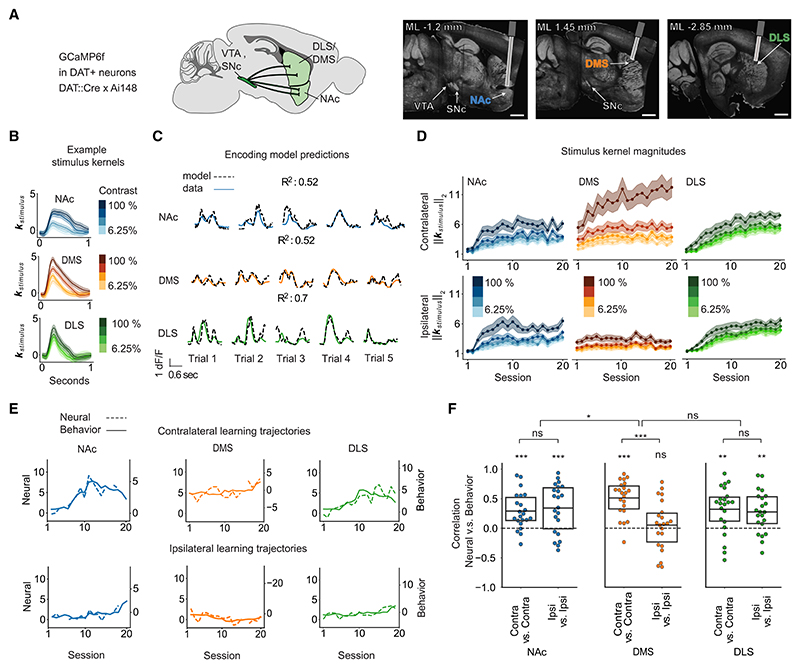
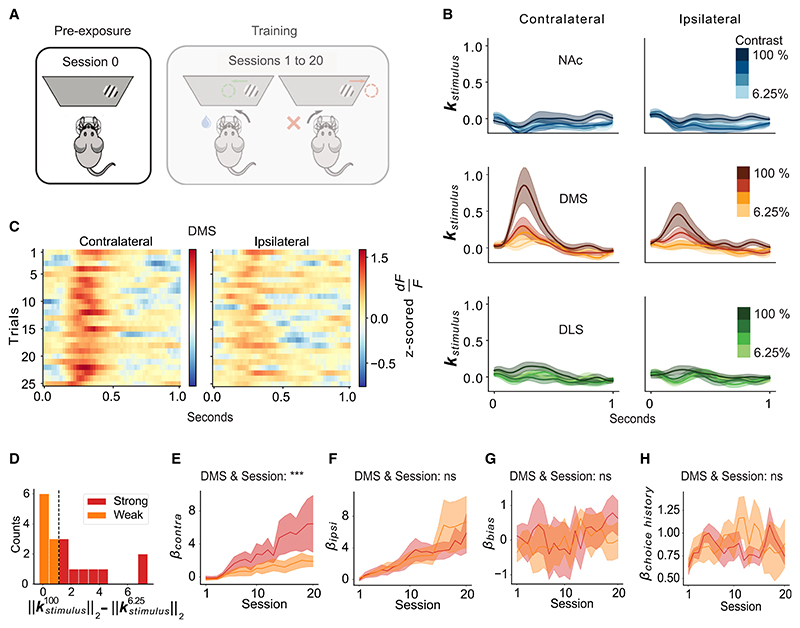
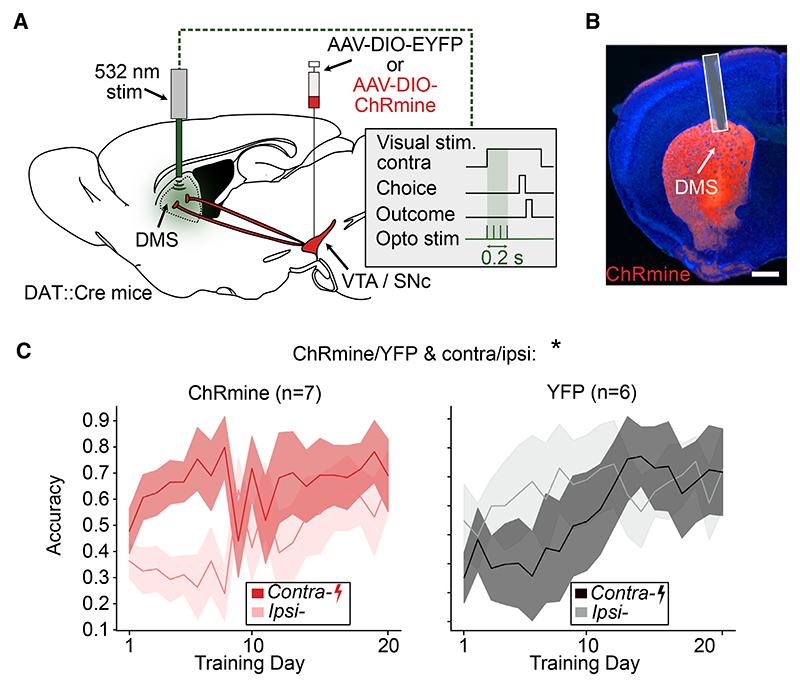
A key challenge of learning a new task is that the environment is high dimensional-there are many different sensory features and possible actions, with typically only a small reward-relevant subset. Although animals can learn to perform complex tasks that involve arbitrary associations between stimuli, actions, and rewards,1,2,3,4,5,6 a consistent and striking result across varied experimental paradigms is that in initially acquiring such tasks, large differences between individuals are apparent in the learning process.7,8,9,10,11,12 What neural mechanisms contribute to initial task acquisition, and why do some individuals learn a new task much more quickly than others? To address these questions, we recorded longitudinally from dopaminergic (DA) axon terminals in mice learning a visual decision-making task.7 Across striatum, DA responses tracked idiosyncratic and side-specific learning trajectories, consistent with widespread reward prediction error coding across DA terminals. However, even before any rewards were delivered, contralateral-side-specific visual responses were present in DA terminals, primarily in the dorsomedial striatum (DMS). These pre-existing responses predicted the extent of learning for contralateral stimuli. Moreover, activation of these terminals improved contralateral performance. Thus, the initial conditions of a projection-specific and feature-specific DA signal help explain individual learning trajectories. More broadly, this work suggests that functional heterogeneity across DA projections may serve to bias target regions toward learning about different subsets of task features, providing a potential mechanism to address the dimensionality of the initial task learning problem.

Keywords: basal ganglia; dopamine; dorsomedial striatum; individual differences; reinforcement learning; visual decision-making.


Conflict of interest statement

Declaration of interests The authors declare no competing interests.

Figures

Graphical abstract
Graphical abstract
Figure 1
Figure 1. Idiosyncratic and side-specific learning trajectories
(A) Schematic of the task. On each trial, a Gabor patch of a different contrast (6.12%, 12.5%, 25%, or 100%) is presented on the right or left side of a screen. Centering the patch with a steering wheel leads to a small water reward, whereas moving it out of the screen results in a short timeout (2 s) and white noise (0.5 s). (B) Accuracy (fraction of trials rewarded) across training sessions. (C) Probability of right choices across training sessions. In (B) and (C), each line represents one mouse, colored by their mean accuracy in sessions 16–20. (D) Schematic of the behavioral model. Choice (left or right) on each trial is predicted with a logistic function based on weighting the contrast of the right and left visual stimulus (βright and βleft), a bias term (βbias) coded such that positive values indicate rightward choice, and a choice history kernel. Weights evolved across sessions (see STAR Methods for details). (E) Psychometric curves (“data”) and model fits (“model”) from 3 example mice on the first, middle, and last session of training. Lines and shading represent mean ± SEM. (F) Model weights across training for the same mice from (E). Lines and shading represent mean and 95% confidence intervals. (G) Early βbias (average of sessions 1–5) for all the mice, showing the subdivisions used in subsequent panels between mice with weak, left, or right initial bias. (H–J) Average trajectories of bias, right and left stimulus weights across training for mice subdivided by their initial bias as shown in (G). Lines and shading represent mean ± SEM across mice. (K and L) Relationship between early βbias (average of sessions 1–5) and the late difference in stimulus sensitivity weights (βright - βleft for sessions 16–20). r = 0.417, p = 0.0007. (I) Relationship between early βbias (sessions 1–5) and late βbias (sessions 16–20). R = 0.174, p = 0.522. In (K) and (L), each dot is a mouse. Correlation and p values from robust regression. **p < 0.01; ns, not significant. Across all panels, n = 22 mice. See also Figure S1.
Figure 2
Figure 2. In DA terminals across the striatum, contrast-dependent visual responses track individual side-specific learning trajectories
(A) Experimental strategy used for collecting the fiber photometry data from DA terminals. Left: schematic of the recorded projections using the GCamPG6f × DAT::Cre mouse line. Right: example histology. Scale bar, 1 mm. (B) Contralateral stimulus response kernels from an example mouse on an example session. (C) Z scored dF/F (solid line) and predictions from the encoding model (dashed line) on 5 different trials for an example mouse on an example session. R is the variance explained across the session within all trial epochs (from stimulus onset to 1 s after feedback). (D) Stimulus response magnitudes (L2-norm) in each region and session, averaged across mice, for contralateral (top) and ipsilateral (bottom) stimuli. Lines and shading represent mean ± SEM. (E) Trajectories of the contrast-dependence of neural stimulus response magnitudes (“neural”; difference in L2-norm for 100% and 6.25% contrast) and the behavioral stimulus choice weights (“behavioral”) for contralateral (top) and ipsilateral (bottom) stimuli (from an example mouse in which DMS is recorded on one hemisphere and DLS/NAc on the other). (F) Correlations of the neural and behavioral trajectories as shown in (E). p values calculated with t tests. *p < 0.05, **p < 0.01, ***p < 0.001; ns, not significant. See Table S1 for statistical details for (F). n = 22 mice in (D) and (F). See also Figures S2 and S3.
Figure 3
Figure 3. Pre-existing visual responses in DMS DA terminals predict side-specific learning trajectories
(A) Schematic of the stimulus pre-exposure session before training (“session 0”). (B) Stimulus response kernels in the NAc, DMS, and DLS for contralateral and ipsilateral stimuli of each contrast, averaged across mice, during session 0 (pre-exposure). Lines and shading represent mean ± SEM. (C) Heatmap of stimulus responses on session 0 to 100% contrast stimuli in the DMS for the first 25 trials, averaged across mice. (D) Histogram across mice of contrast-dependent contralateral stimulus responses on session 0, quantified as the difference in the L2-norm of the highest and lowest contrast contralateral stimulus, colored by a median split. (E) Contralateral stimulus sensitivity weights from the behavioral model for mice with strong vs. weak contralateral contrast-dependent stimulus responses during session 0 (subdivision of mice shown in D). Lines and shading represent mean ± SEM. ***p < 0.001 for the interaction between DMS stimulus response on session 0 and session in a two-way ANOVA (see Data S1.1–S3.2 for model details and full results). (F) Same as (E), except for the ipsilateral stimulus weight from the behavioral model. No significant interaction (ns) between DMS stimulus response on session 0 and session (see Data S1.3–S3.4 for model details and full results). (G) Same as (E) and (F), but for the bias weights from the behavioral model (transformed such that positive means contralateral bias). No significant interaction (ns) between DMS stimulus response on session 0 and session (see Data S1.5–S3.6 for model details and full results). In all panels, n = 18 mice. (H) Same as (G), but for the choice history weights from the behavioral model. No significant interaction (ns) between DMS stimulus response on session 0 and session (see Data S1.7 and 3.8 for model details and full results). See also Figures S2, S4, and S5 and Data S1.
Figure 4
Figure 4. Stimulating DMS DA terminals at the onset of contralateral stimulus presentation improves side-specific performance
(A) Schematic of the optogenetic stimulation of DMS DA terminals. Mice either expressed ChRmine or a control construct in DA neurons. DA terminals in the DMS were optogenetically stimulated unilaterally (532 nm, 0.2 s burst duration, 5 ms pulse width, 20 Hz pulses, ~0.25 mW) at the onset of the contralateral stimulus presentation throughout training. (B) Example histology image of optical fiber location and terminal expression of ChRmine-mScarlet. Scale bar, 900 μm. (C) Comparison of performance for contralateral and ipsilateral stimulus trials in control (n = 7, left) and ChRmine (n = 6, right) mice. Lines and shading represent mean ± SEM. *p < 0.05 for cohort (ChRmine/YFP) and side (contra/ipsi) interaction in three-way ANOVA with cohort (ChRmine/YFP), day, and side (contralateral/ipsilateral) as factors (see Table S2 for model details and full results). See also Figures S1 and S2 and Table S2.

References

    1. Hu F, Kamigaki T, Zhang Z, Zhang S, Dan U, Dan Y. Prefrontal corticotectal neurons enhance visual processing through the superior colliculus and pulvinar thalamus. Neuron. 2019;104:1141–1152.:e4. - PubMed
    1. Siniscalchi MJ, Phoumthipphavong V, Ali F, Lozano M, Kwan AC. Fast and slow transitions in frontal ensemble activity during flexible sensorimotor behavior. Nat Neurosci. 2016;19:1234–1242. doi: 10.1038/nn.4342. - DOI - PMC - PubMed
    1. Pinto L, Dan Y. Cell-type-specific activity in prefrontal cortex during goal-directed behavior. Neuron. 2015;87:437–450. doi: 10.1016/j.neuron.2015.06.021. - DOI - PMC - PubMed
    1. Mah A, Schiereck SS, Bossio V, Constantinople CM. Distinct value computations support rapid sequential decisions. bioRxiv. 2023 doi: 10.1038/s41467-023-43250-x. - DOI - PMC - PubMed
    1. Platt ML, Glimcher PW. Neural correlates of decision variables in parietal cortex. Nature. 1999;400:233–238. - PubMed

LinkOut - more resources