. 2024 Oct 16;15(1):8912.
doi: 10.1038/s41467-024-53178-5.

Phosphorylation-driven epichaperome assembly is a regulator of cellular adaptability and proliferation

Affiliations

Phosphorylation-driven epichaperome assembly is a regulator of cellular adaptability and proliferation

Tanaya Roychowdhury et al. Nat Commun. .

Abstract

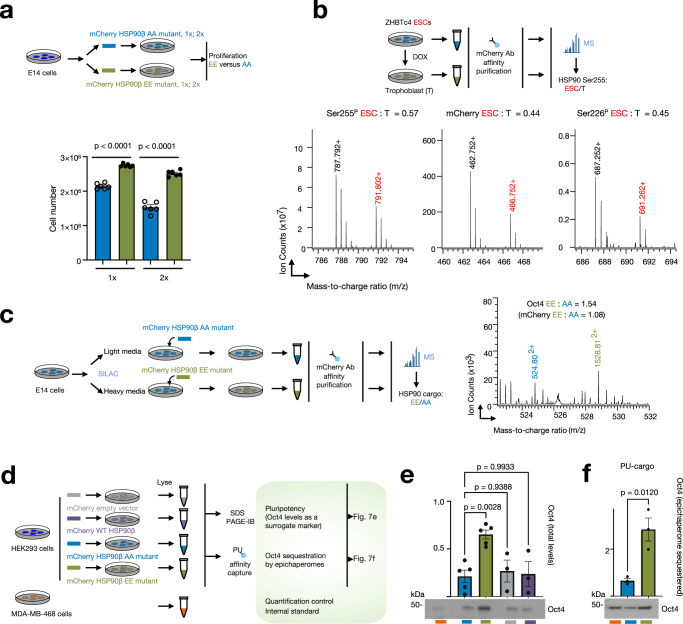
The intricate network of protein-chaperone interactions is crucial for maintaining cellular function. Recent discoveries have unveiled the existence of specialized chaperone assemblies, known as epichaperomes, which serve as scaffolding platforms that orchestrate the reconfiguration of protein-protein interaction networks, thereby enhancing cellular adaptability and proliferation. This study explores the structural and regulatory aspects of epichaperomes, with a particular focus on the role of post-translational modifications (PTMs) in their formation and function. A key finding is the identification of specific PTMs on HSP90, particularly at residues Ser226 and Ser255 within an intrinsically disordered region, as critical determinants of epichaperome assembly. Our data demonstrate that phosphorylation of these serine residues enhances HSP90's interactions with other chaperones and co-chaperones, creating a microenvironment conducive to epichaperome formation. Moreover, we establish a direct link between epichaperome function and cellular physiology, particularly in contexts where robust proliferation and adaptive behavior are essential, such as in cancer and pluripotent stem cell maintenance. These findings not only provide mechanistic insights but also hold promise for the development of novel therapeutic strategies targeting chaperone assemblies in diseases characterized by epichaperome dysregulation, thereby bridging the gap between fundamental research and precision medicine.


Conflict of interest statement

Memorial Sloan Kettering Cancer Center holds the intellectual rights to the epichaperome portfolio. G.Chiosis., A.R., and S.S. are inventors on the licensed intellectual property. All other authors declare no competing interests.

Figures

Fig. 1
Fig. 1. Embryonic stem cells and cancer cells share compositionally similar epichaperomes.
a Schematic illustrating the biochemical and functional distinctions between epichaperomes, defined as long-lasting hetero-oligomeric assemblies composed of tightly associated chaperones and co-chaperones, and traditional chaperones. Unlike chaperones, which assist in protein folding or assembly, epichaperomes sequester proteins, reshaping protein–protein interactions, and consequently altering cellular phenotypes. The schematic also outlines key principles for the use of PU-probes—PU-beads and PU-clicked to a fluorophore such as cy5—in epichaperome analysis. b Detection of epichaperome components (chaperones and co-chaperones) through SDS–PAGE (bottom, total protein levels) and native PAGE (top), followed by immunoblotting. See also Supplementary Fig. 1. c Visualization of HSP90 in epichaperomes using the PU-TCO probe clicked to cy5. See also Supplementary Fig. 2. Gel images are representative of three independent experiments. d Epichaperome constituent chaperones and co-chaperones identified through mass spectrometry analyses of PU-beads cargo. Representative data of two independent experiments. See Supplementary Fig. 3 for the GA cargo. HSP7C is HSC70, STIP1 is HOP, and AHSA1 is AHA1. e Illustration of an isobaric, discriminant peptide pair from ESC lysate samples and HSP90 captured by PU- and GA-beads. Representative data of two independent experiments. f Schematic summary. Both cancer cells and pluripotent stem cells harbor epichaperomes. These epichaperomes undergo disassembly during differentiation processes. Source data are provided in Supplementary Data 1 and as a Source data file.
Fig. 2
Fig. 2. An enrichment of the closed-like conformation of HSP90 favors epichaperomes formation.
a Experiment outline. DSS disuccinimidyl suberate crosslinker. b Plot comparing cross-linking propensity of Lys residues in HSP90 bound to PU-H71 or geldanamycin (GA). Average cross-linking percentage of PU-H71 (x-axis) and GA (y-axis) bound HSP90 cross-linked pairs are shown. Pairs with similar cross-linking propensity are shown along the dotted line with a slope of 1. Outlier cross-linked peptides are those with cross-linked Lys residues eight amino acids away and a cross-linking percentage difference ≥1.5 standard deviations of replicates. Statistically significant outliers (p ≤ 0.05) were determined by two-sample t-test with equal variances, n = 3 replicate measurements. c Homology model illustrating the HSP90 dimer in the open conformation (template PDB: 2IOQ), favored by GA, and the closed conformation (template PDB: 2CG9), favored by PU-H71. One HSP90 protomer is colored to indicate the N-terminal domain (NTD), the middle domain (MD), and the C-terminal domain (CTD). Cross-linked residues are shown as dashed lines between labeled residues. d NTD structures of PU-H71 (top, PDB: 2FWZ) and GA (bottom, PDB: 1YET)-bound HSP90. Source data are provided in Supplementary Data 2.
Fig. 3
Fig. 3. Phosphorylation of key residues located in the charged linker supports HSP90 incorporation into epichaperomes.
a Experiment outline and expected outcomes. b Tandem mass spectrometry (MS) spectra of HSP90 Ser226 (bottom) and Ser255 (top) phosphorylated peptides are presented, supporting the sequence and phosphorylation site identification. c Comparison of the extracted ion chromatogram of HSP90 Ser255 phosphopeptide in the PU-bead cargo and ESC lysate (bottom) with a representative unmodified tryptic peptide in the PU-bead cargo and ESC lysate (top). d Ion intensity values of all identified phosphopeptides and the ratio of mean peptide intensity for each phosphosite in the samples described in (a) (i.e., n = 4 Ca and n = 2 NT cell lines). Each data point represents an individual phosphopeptide, and data are presented as mean ± s.e.m. to illustrate variability between peptides across the cell lines. e Ratio of individual peptide intensity for each phosphosite in the samples described in the schematic (graph: mean ± s.e.m., S255 n = 5; S226 n = 4; S263 n = 8; S231 n = 5). Source data are provided as a Source Data file and in Supplementary Data 3 and 4.
Fig. 4
Fig. 4. Phosphorylation of key residues located in the charged linker of HSP90 leads to a conformational shift in the linker, exposing the middle domain of the protein.
a Model of the HSP90–HSP90–HSP70–HSP70–HOP assembly used for the molecular dynamics simulations. A and B, protomers A and B, respectively. b Protein secondary structure elements (SSE) like alpha-helices and beta-strands of the charged linker of protomer A of ATP-bound HSP90 monitored throughout the molecular dynamics simulation. WT (HSP90S226/S255), phosphomimetic (HSP90S226E/S255E), and non-phosphorylatable (HSP90S226A/S255A) mutants were analyzed. Each pentameric assembly was simulated three times for 100 ns, yielding similar results across simulations. The plot on the left reports SSE distribution by residue index throughout the charged linker and the plot on the right monitors each residue and its SSE assignment over time. Schematic illustrating the primary structure of the full-length HSP90 with color-coded domains is also shown: NTD N-terminal domain; MD middle domain and CTD C-terminal domain. The charged linker (CL) and the location of the two key serine residues are also shown (top inset). The gray bar indicates the CL segment encompassing residues 218–232. c Cartoon representation of ATP-bound HSP90 protomer A in assemblies with either the phosphomimetic (HSP90S226E/S255E) or non-phosphorylatable (HSP90S226A/S255A) mutants. The figure depicts the reference trajectory and representative trajectories from n = 1000 simulation frames. The inset illustrates the surfaces available for the interaction between HSP90 A and HSP70 A when the CL is in the up conformation. The arrow indicates the location of the key beta-strand in the charged linker. See also Supplementary Figs. 5–9.
Fig. 5
Fig. 5. Phosphorylation of key residues located in the charged linker of HSP90 facilitates assembly motions conducive to epichaperome core formation.
a Dynamic cross-correlation matrix of Cα atoms for 100 ns molecular dynamics simulations of ATP-bound assemblies containing WT (HSP90S226/S255), phosphomimetic (HSP90S226E/S255E) or non-phosphorylatable (HSP90S226A/S255A) HSP90. Correlated and anti-correlated motions are shown in the matrix and represented in the cartoon. The color of the arrows in the cartoon corresponds to the colors shown in the correlation index bar, with darker blue indicating stronger co-movement (positive correlation) and darker red indicating stronger opposite movement (negative correlation). The assembly contains two full-length HSP90β proteins (protomer A and protomer B). The two HSP70 proteins (HSP70 A and HSP70 B) and the HOP protein are of sizes reported, and as per the constructs used in 7KW7. b Cartoon showing assemblies that are preferentially formed when the HSP90 charged linker is either phosphorylated (as in the EE mutant) or not phosphorylated (as in the WT protein). c The plot depicts the root mean square fluctuation (RMSF) values for each residue within the ATP-bound HSP90 assemblies across different conditions. Each point along the x-axis corresponds to a specific residue in the protein sequence of HSP70A, HSP70B, and HOP. The y-axis represents the RMSF value in angstroms (Å), indicating the average flexibility of each residue. Higher RMSF values suggest greater flexibility, while lower values indicate rigidity. Arrowheads highlight areas where the structural dynamics diverge significantly. See Supplementary Fig. 8 for the full assembly. d The plot depicts the combined global coordinated motions of all Cα atoms in ATP-bound assemblies within the PC1 and PC2 component space, representing the major directions of variance in the simulations. Each point corresponds to a frame in the simulation, illustrating the assembly’s conformational state. Different sub-spaces for WT and EE mutants have been merged here for comparison. ad Each condition was simulated three times with similar results. Source data are provided in Supplementary Data 5 and as a Source data file.
Fig. 6
Fig. 6. Phosphorylation of key residues located in the charged linker supports HSP90 incorporation into epichaperomes.
a Overview of the experimental design and expected outcomes. b Analysis of transfection efficacy in cells transfected with HSP90β mutants, as indicated in (a). c Detection of epichaperome components (chaperones and co-chaperones) through SDS–PAGE (bottom, total protein levels) and native PAGE (top), followed by immunoblotting. Brackets indicate the approximate position of epichaperome-incorporated chaperones. Data are presented as mean ± s.e.m., n = 3, one-way ANOVA with Sidak’s post-hoc, EE vs AA. d Visualization of HSP90 in epichaperomes using the PU-TCO probe clicked to Cy5 (left) and the mCherry tag (middle). Right, merged images. MWM molecular weight marker. e Detection and quantification of epichaperome components through PU-beads capture as indicated in (a). Protein amount loaded for input represents 2% of the protein amount incubated with the beads. Data are presented as mean ± s.e.m., n = 3, unpaired two-tailed t-test. Gel images are representative of three independent experiments. Source data are provided as a Source data file.
Fig. 7
Fig. 7. Phosphorylation of key residues located in the HSP90 charged linker favors ESC proliferation and self-renewal potential.
a ESC proliferation at 60 h post-transfection in E14 cells transfected with either the phosphomimetic HSP90βS226E,S255E (EE) or the non-phosphorylatable HSP90S226A,S255A (AA) mutant. Medium (1×) or high (2×) plasmid concentrations were employed. Data are presented as mean ± s.e.m., n = 6, one-way ANOVA with Sidak’s post-hoc, EE vs AA. b Representative spectra (n = 3 independent experiments) of phosphopeptides, S255P (left) and S226P (right), and a representative unmodified tryptic peptide (middle) in mCherry-tagged WT HSP90β affinity-purified from ESC or differentiated trophoblast (T) cells. c Representative spectra (n = 3 independent experiments) of a tryptic peptide from Oct4 protein co-purified from ESCs labeled with heavy or light isotope lysine and arginine expressing either the EE or the AA HSP90 mutant. Quantitative analysis via mass spectrometry (MS) to determine protein abundance is shown. d Overview of the experimental design and expected outcomes (for e and f). e, f Detection and quantification of Oct4 protein expressed in cells transfected with the indicated HSP90 mutants or vector control (e) and sequestered into the epichaperome platforms (identified through PU-beads capture, f). Data are presented as mean ± s.e.m., n = 5 AA, n = 5 EE, n = 3 WT, n = 3 empty vector, one-way ANOVA with Dunnett’s post-hoc, EE vs AA, WT vs AA, empty vector vs AA (for e) and as mean ± s.e.m., n = 3, unpaired two-tailed t-test (for f). Source data are provided as a Source Data file and in Supplementary Data 6 and 7.
Fig. 8
Fig. 8. Regulation of epichaperome processes in ESC and cancer cells hinges on the specific phosphorylation events occurring at key residues within HSP90’s charged linker.
a Overview of the experimental design and expected outcomes. b Detection and quantification of proteins involved in transducing signaling events that lead to cell proliferation, survival, and protein synthesis control. See Supplementary Fig. 14 for total protein levels and levels sequestered into epichaperomes. Data are presented as mean ± s.e.m., p-S6 n = 8; p-mTOR n = 3; p-MEK1/2 n = 6; p-AKT n = 5, unpaired two-tailed t-test. c Confocal microscopy shows morphological differences between the cells transfected with either the AA or the EE HSP90 mutant. Micrographs are representative of 96 cells for EE and 62 cells for AA. Scale bar, 10 µm. Data are presented as mean ± s.e.m., n = 8 wells for EE, n = 14 wells for AA, unpaired two-tailed t-test. Source data are provided as a Source data file.
Fig. 9
Fig. 9. Casein kinase 2 (CK2) is a physiologic regulator of epichaperome formation by modulating the phosphorylation of key residues within HSP90’s charged linker.
a, b The gels illustrate the resulting epichaperome formation and the phosphorylation status of HSP90 in lysed MDA-MB-468 epichaperome-positive cancer cells treated with CK2 inhibitors. Detection of epichaperome components was done through SDS–PAGE (total protein levels) and native PAGE followed by immunoblotting. a The effect of CX4945 treatment, while b depicts the effect of CIBG-300 treatment. Vehicle-treated cells serve as controls. CK2α levels are shown to verify that inhibitor treatment effects are independent of changes in CK2α expression levels. c Same as in (a, b) for CK2α knockdown using dose-dependent siRNAs in MDA-MB-468 cells. CK2α levels, knockdown efficiency control. d The indicated CK2 constructs were used to transfect HEK293 cells. CK2α, catalytic subunit; CK2β, regulatory subunit; kinase-dead mutant CK2 K68M α. HA tag and CK2α levels, transfection efficacy control. ad Gel images are representative of three independent experiments. Source data are provided as a Source data file. e Schematic summary. CK2’s phosphorylation activity directly influences the stability and assembly of epichaperomes. These findings confirm the functional role of HSP90 phosphorylation at these specific serine residues in epichaperome formation and posit CK2 as a likely physiological candidate behind epichaperome formation.
Fig. 10
Fig. 10. Human tissues positive for epichaperomes exhibit p-Ser226 HSP90β positivity, and conversely, those negative for epichaperomes show no or negligible p-Ser226 signal within HSP90’s charged linker.
a Cartoon illustrating the processing of human tissue for biochemical analyses. Both tumor (T) and tumor-adjacent (TA) tissues, determined by gross pathological evaluation to be potentially non-cancerous, were harvested and analyzed. b MDA-MB-468 breast cancer cells (epichaperome-high) and ASPC1 pancreatic cancer cells (epichaperome-low) served as controls for assessing p-Ser226 HSP90 levels. Gel images are representative of three independent experiments. c The graph presents the relationship between epichaperome positivity and HSP90 Ser226 phosphorylation for tissues described in (a). Data represent mean ± s.e.m., with n = 9 tumor (T) and n = 9 paired tumor-adjacent (TA) tissues classified based on epichaperome positivity or negativity, as determined by native PAGE (see d); unpaired two-tailed t-test. d Detection of epichaperomes through native PAGE (top), and of p-Ser226 HSP90 (middle) and total HSP90 (bottom) by SDS–PAGE, followed by immunoblotting, in tissues from the indicated patient specimens, as in (a). Brackets indicate the approximate position of epichaperome-incorporated HSP90. Note: obtaining genuinely “normal” tissue adjacent to tumors presents challenges, especially in the case of pancreatic tissue. The relatively small size of the organ and the nature of surgical procedures for pancreatic cancer often lead to the collection of normal samples in close proximity to the tumor. It’s crucial to acknowledge that, due to these challenges, we designate potentially normal tissue as tumor-adjacent tissue, recognizing that it may not entirely reflect a truly normal tissue state. PDAC pancreatic ductal adenocarcinoma, IDC invasive ductal carcinoma, ILC invasive lobular carcinoma, ER estrogen receptor, PR progesterone receptor. Source data are provided as a Source data file.

Update of

References

    1. Bludau, I. & Aebersold, R. Proteomic and interactomic insights into the molecular basis of cell functional diversity. Nat. Rev. Mol. Cell Biol.21, 327–340 (2020). - PubMed
    1. Nussinov, R., Tsai, C. J. & Jang, H. Protein ensembles link genotype to phenotype. PLoS Comput. Biol.15, e1006648 (2019). - PMC - PubMed
    1. Chiosis, G., Digwal, C. S., Trepel, J. B. & Neckers, L. Structural and functional complexity of HSP90 in cellular homeostasis and disease. Nat. Rev. Mol. Cell Biol.24, 797–815 (2023). - PMC - PubMed
    1. Schopf, F. H., Biebl, M. M. & Buchner, J. The HSP90 chaperone machinery. Nat. Rev. Mol. Cell Biol.18, 345–360 (2017). - PubMed
    1. Krukenberg, K. A., Street, T. O., Lavery, L. A. & Agard, D. A. Conformational dynamics of the molecular chaperone Hsp90. Q. Rev. Biophys.44, 229–255 (2011). - PMC - PubMed

Publication types