. 2024 Oct 16;15(1):8929.
doi: 10.1038/s41467-024-53091-x.

Genetic architecture of routinely acquired blood tests in a British South Asian cohort

Collaborators, Affiliations

Genetic architecture of routinely acquired blood tests in a British South Asian cohort

Benjamin M Jacobs et al. Nat Commun. .

Abstract

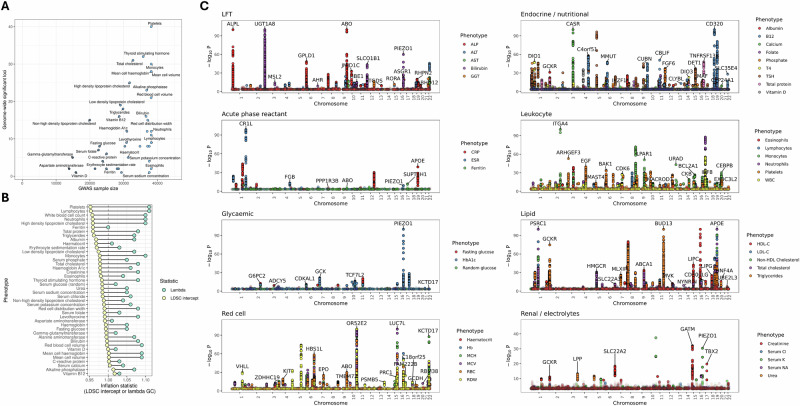
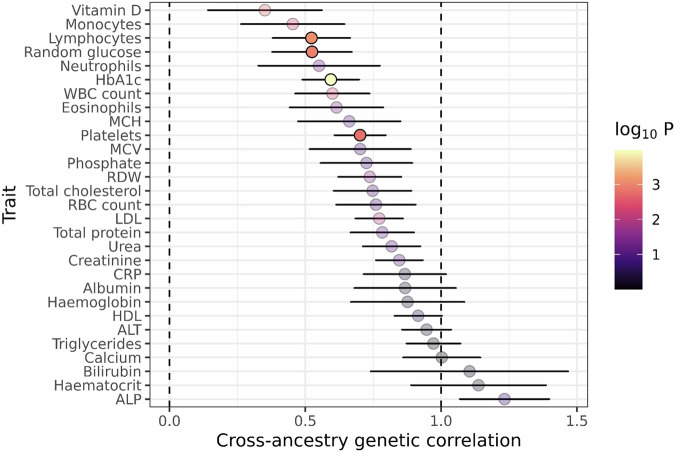
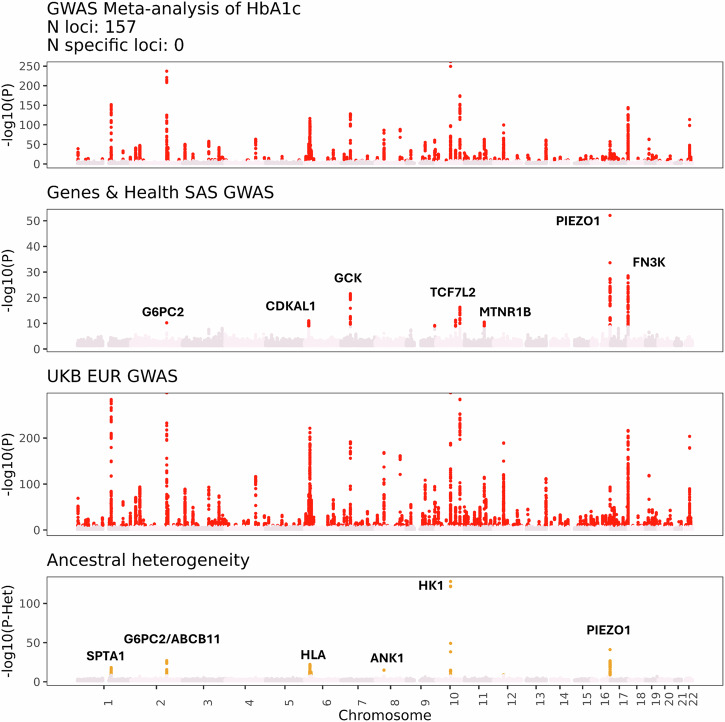
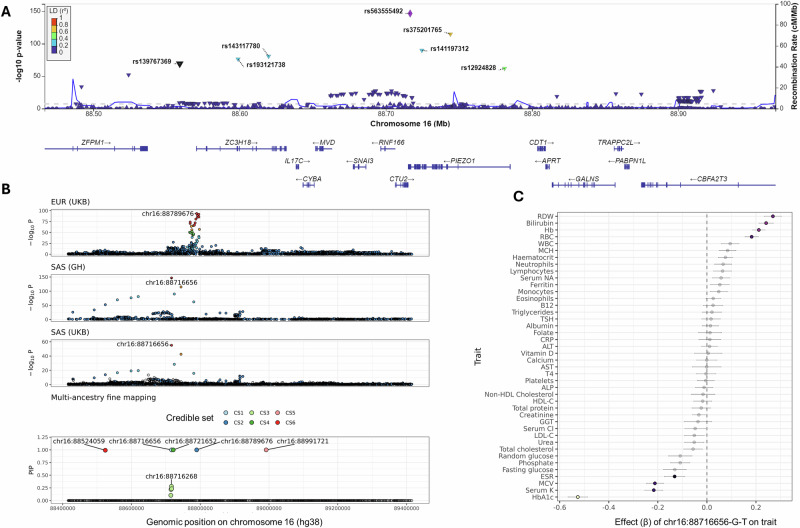
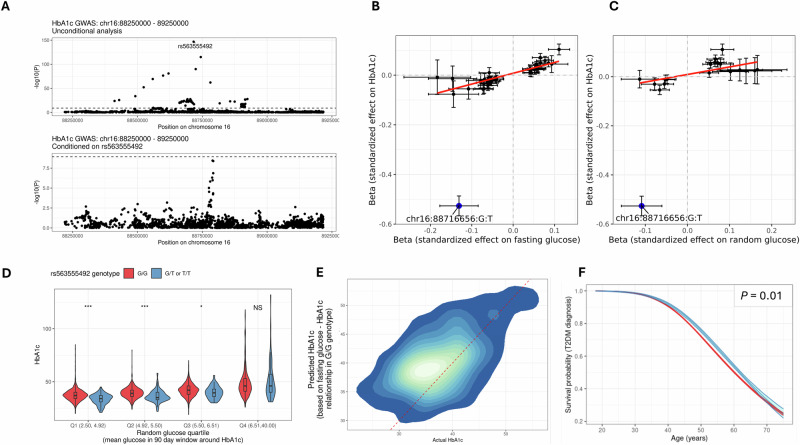
Understanding the genetic basis of routinely-acquired blood tests can provide insights into several aspects of human physiology. We report a genome-wide association study of 42 quantitative blood test traits defined using Electronic Healthcare Records (EHRs) of ~50,000 British Bangladeshi and British Pakistani adults. We demonstrate a causal variant within the PIEZO1 locus which was associated with alterations in red cell traits and glycated haemoglobin. Conditional analysis and within-ancestry fine mapping confirmed that this signal is driven by a missense variant - chr16-88716656-G-TT - which is common in South Asian ancestries (MAF 3.9%) but ultra-rare in other ancestries. Carriers of the T allele had lower mean HbA1c values, lower HbA1c values for a given level of random or fasting glucose, and delayed diagnosis of Type 2 Diabetes Mellitus. Our results shed light on the genetic basis of clinically-relevant traits in an under-represented population, and emphasise the importance of ancestral diversity in genetic studies.


Conflict of interest statement

The authors declare no competing interests.

Figures

Fig. 1
Fig. 1. GWAS of routinely acquired blood tests in a South Asian ancestry cohort.
A Scatter plot displaying the relationship between GWAS sample size (x axis) and the number of study-wide significant independent genetic loci for each trait examined in the Genes & Health Cohort. Independent loci were defined using in-sample LD to clump results (distance 1KB, R2 0.001) and a study-wide significance threshold of P < 1.2 × 10−9. B Forest plot indicating the degree of test statistic inflation for each GWAS trait. The x axis shows the inflation statistic—either the LDSC intercept (yellow) or the genomic inflation factor (λ, light green). The y-axis indicates the trait. C Manhattan plots showing the results from the Genes & Health GWAS. P values are truncated at P < 1e-100 for clarity. Traits are divided by broad subtype. For each trait category, only SNPs passing the study-wide significance threshold are shaded in full colour. Other SNPs are translucent. SNPs with P > 0.001 are not shown for clarity. The top SNP (i.e. lowest P value) within each category for each chromosome is annotated with the nearest gene. Some labels are omitted for clarity. P values reflect the output of the GWAS models (mixed linear models) implemented in REGENIE.
Fig. 2
Fig. 2. Cross-ancestry genetic correlations between South Asian ancestry GWAS in the Genes & Health cohort and UK Biobank European-ancestry GWAS.
Forest plot showing the cross-ancestry genetic correlation (genetic effect) estimated for each trait between the Genes & Health GWAS and UK Biobank European-ancestry GWAS. The points are shaded by the −log10(P) for the P value assessing the hypothesis that the estimate is below one (Z-test). The dashed lines indicate 0 i.e., no genetic correlation, and 1 i.e., perfect genetic correlation. Horizontal bars indicate the 95% confidence intervals. The centre of the bars reflects the estimate for the cross-ancestry genetic correlation. Note that the estimate is unbounded, hence in some cases the estimate is over one. Points are greyed out if the estimate was not significantly different from 1 at a study-wide significance threshold of P < 0.05/29. Sample sizes used for these estimates are given in Supplementary Data 3 (for Genes & Health) and Supplementary data 6 (for UK Biobank).
Fig. 3
Fig. 3. Multi-ancestry meta-analysis of glycated Haemoglobin (HbA1c).
Manhattan plots showing the GWAS of HbA1c in the multi-ancestry meta-analysis (top panel), the Genes & Health GWAS (second panel), the UKB EUR GWAS (third panel), and the P values for ancestral heterogeneity (bottom panel) for each SNP derived from the meta-analysis. Selected genes are highlighted. Multi-ancestry meta-analysis was conducted using MR-MEGA. Ancestral heterogeneity P values refer to the strength of evidence supporting the hypothesis that SNP effect sizes at a locus were correlated with ancestral principal components, derived from summary statistics.
Fig. 4
Fig. 4. Cross-ancestry meta-analysis and fine mapping at the PIEZO1 locus for HbA1c.
A Locus plot showing the regional association of at the PIEZO1 locus for HbA1c in the Genes & Health GWAS. The lead variant is coloured in purple, and other variants are coloured according to their strength of LD with the lead variant (derived from the 1000 Genomes reference samples of South Asian ancestry). B Panels display the regional association results at the PIEZO1 locus on chromosome 16 from UKB EUR-ancestry GWAS (top, N = 400,825), Genes & Health SAS GWAS (middle, N = 30,967), UKB SAS-ancestry GWAS (third from top, N = 8329) and cross-ancestry fine mapping (SuSieEx, bottom). Points are coloured according to their LD with the lead variant in each ancestry for the top three panels, which is labelled with the SNP identifier. For the bottom panel, each of the independent credible sets is coloured separately and indicated in the legend. Of the six causal signals, one was SAS-specific (indicated as ‘CS1’ on the plot), i.e. the causal signal had a posterior probability of >0.8 in the Genes & Health SAS and UKB SAS ancestries, but no other ancestry group in UKB (of EUR, AFR and EAS). This signal was mapped to a single causal variant, chr16-88716656-G-T. The top SNPs—i.e. the SNP with PIP > 0.1—are shown per credible set. Genomic co-ordinates are in hg38. C Forest plot showing pleiotropic association of the missense variant in PIEZO1 (chr16-88716656-G-T; rs563555492) with various red cell traits in Genes & Health. Beta effect sizes represent the per-allele effect on rank-inverse normalised trait values in the Genes & Health GWAS. Error bars represent the 95% confidence interval, and are centred on the effect size estimate. Associations achieving study-wide significance are coloured in, the remainder are shown as translucent. Sample sizes differ by trait and are shown in Supplementary Data 3.
Fig. 5
Fig. 5. The PIEZO1 missense variant chr16-88716656-G-T influences HbA1c by affecting red blood cell lifespan, and is associated with a delay in T2DM diagnosis.
A Regional Manhattan plots showing association with HbA1c at the PIEZO1 locus in the unconditional analysis (top panel) and after conditioning on chr16-88716656-G-T (bottom panel). No SNPs surpassed study-wide significance in the conditional analysis, confirming that chr16-88716656-G-T accounts for the majority of the signal at this locus. B Scatter plot showing the impact (i.e. GWAS effect estimate) of SNPs associated with fasting glucose (N for fasting glucose GWAS = 22,848) on HbA1c from the G&H GWAS. SNPs associated with fasting glucose at P < 1 × 10−5 are shown. The red line indicates a linear regression fit to the SNPs excluding the PIEZO1 variant chr16-88716656-G-T, which is shown in blue. Error bars indicate the confidence intervals, centred on the effect size estimate. The scales refer to the GWAS effect scales, i.e. reflect rank-normalised traits. Although chr16-88716656-G-T was associated with lowered glucose, the reduction in HbA1c is greater than SNPs with an comparable impact on glucose. C As per B, but for random glucose rather than fasting glucose (N = 21,527). D Violin plots contrasting the HbA1c level within each quartile of random glucose for individuals with contemporaneous (i.e. within 90 days of each other) HbA1c and random glucose readings (N = 2956). P values are indicated as follows: ***<0.0005, **<0.005, *<0.05, NS ≥ 0.05. P values reflected unpaired t test comparisons between groups. Violins are coloured by genotype. The random glucose quartile is indicated alongside the range each quartile represents. The violin plot goes from the minimum to the maximum. The nested box plot shows the median, 25th and 75th centiles, and the whiskers extend from the minimum and maximum. E Density plot showing the observed vs expected HbA1c values among chr16-88716656-G-TT carriers. The expected HbA1c value was derived from linear regression of fasting glucose on HbA1c among G/G homozygotes, adjusted for age and gender. The red dotted line indicates a smoothed ‘expected’ line. The density cloud shows that the majority of chr16-88716656-G-TT carriers lie above this line, i.e. their expected HbA1c is greater than their actual HbA1c. F Survival curves showing the lower probability of T2DM diagnosis in carriers of the T allele, supporting the concept that this allele delays diagnosis.

References

    1. Vujkovic, M. et al. Discovery of 318 new risk loci for type 2 diabetes and related vascular outcomes among 1.4 million participants in a multi-ancestry meta-analysis. Nat. Genet.52, 680–691 (2020). - PMC - PubMed
    1. Graham, S. E. et al. The power of genetic diversity in genome-wide association studies of lipids. Nature600, 675–679 (2021). - PMC - PubMed
    1. Mahajan, A. et al. Multi-ancestry genetic study of type 2 diabetes highlights the power of diverse populations for discovery and translation. Nat. Genet.54, 560–572 (2022). - PMC - PubMed
    1. Peterson, R. E. et al. Genome-wide association studies in ancestrally diverse populations: opportunities, methods, pitfalls, and recommendations. Cell179, 589–603 (2019). - PMC - PubMed
    1. Duncan, L. et al. Analysis of polygenic risk score usage and performance in diverse human populations. Nat. Commun.10, 3328 (2019). - PMC - PubMed

Publication types

MeSH terms

LinkOut - more resources