. 2024 Oct 16;15(1):8911.
doi: 10.1038/s41467-024-53308-z.

Expectancy-related changes in firing of dopamine neurons depend on hippocampus

Affiliations

Expectancy-related changes in firing of dopamine neurons depend on hippocampus

Zhewei Zhang et al. Nat Commun. .

Abstract

The orbitofrontal cortex (OFC) and hippocampus (HC) both contribute to the cognitive maps that support flexible behavior. Previously, we used the dopamine neurons to measure the functional role of OFC. We recorded midbrain dopamine neurons as rats performed an odor-based choice task, in which expected rewards were manipulated across blocks. We found that ipsilateral OFC lesions degraded dopaminergic prediction errors, consistent with reduced resolution of the task states. Here we have repeated this experiment in male rats with ipsilateral HC lesions. The results show HC also shapes the task states, however unlike OFC, which provides information local to the trial, the HC is necessary for estimating upper-level hidden states that distinguish blocks. The results contrast the roles of the OFC and HC in cognitive mapping and suggest that the dopamine neurons access rich information from distributed regions regarding the environment's structure, potentially enabling this teaching signal to support complex behaviors.


Conflict of interest statement

The authors declare no competing interests.

Figures
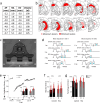
Fig. 1
Fig. 1. Lesions, task design, and behavior.
a Table gives volumes and coordinates (AP and ML relative to bregma and DV relative to brain surface) of injections. b Brain sections illustrate the extent of the maximum (light red) and minimum (dark red) lesion at each level in HCx in the lesioned rats. c Picture of apparatus used in the task, showing the odor port ( ~ 2.5 cm diameter) and two-fluid wells. d Schematic of task design. Deflections indicate the time course of stimuli (odor and reward) presented on each trial. Dashed and solid lines show when a reward was omitted and delivered, respectively. Blue arrows, unexpected reward delivery; Red arrows, unexpected reward omission. e Choice behavior in free-choice trials before and immediately after the block switch and at the end of the subsequent block. Bar graphs indicate average percentage of choice for high-valued reward in first 8 and last 8 trials after block switch. In both groups, rats chose high valued well more often on later trials than earlier trials (Control, p = 2.0e-4; HCx, p = 1.1e-8). Three-way ANOVA comparing Group x Early/Late in choice revealed a significant main effect of value (p = 1.0e-11), but there were no significant main effect of Group (p = 0.41) nor significant interaction of Group x Early/Late (p = 0.70). f Reaction time in response to high and low valued reward on last 10 forced trials across all blocks. Both groups showed faster reaction time when the high valued reward was at stake (Control, p = 0.021; HCx, p = 0.013). g Percentage of correct in response to high and low valued reward on last 10 forced trials across all blocks. Both groups showed higher accuracy when the high-valued reward was at stake (Control, p = 0.019; HCx, p = 0.0025). Three-way ANOVA comparing Group x Value revealed a significant main effect of value in reaction time (p = 2.6e-4) and in percentage of correct (p = 6.5e-5), but there were no main effect of Group (reaction time, p = 0.77; percentage of correct, p = 0.73) nor significant interaction of Group x Value (reaction time, p = 0.16; percentage of correct, p = 0.19). Data in (e-g) are presented as mean values +/− S.E. * in (fg) represents the p < 0.05 from ANOVA. No adjustments were made for multiple comparisons.
Fig. 2
Fig. 2. Characterization of dopamine neurons in control and HCx rats.
a Results of cluster analysis based on the half time of the spike duration and the ratio comparing the amplitude of the first positive and negative waveform segments ((n − p)/(n + p)) in control (left) and HCx (right) groups. Reward responsive dopamine neurons (Rew DA), reward non-responsive dopamine neurons (Non rew DA), non dopamine neurons (non DA). Insets in each panel indicate location of electrode tracks in VTA in red for control (left) and HCx (right) rats. b Bar graphs indicating average amplitude ratio and half duration of putative dopamine neurons in control (black, n = 72) and HCx (gray, n = 117) groups. c Average firing of putative dopamine neurons during reward epochs versus similar 400 ms baseline period taken during the intertrial interval in control (black, n = 72) and HCx (gray, n = 117) groups. Error bars, S.E.M. 2-way ANOVA comparing group (control/HCx) x epoch (reward/baseline) revealed a significant main effect on epoch (p = 4.4e-16) and a significant interaction between group x epoch (p = 7.4e-5).
Fig. 3
Fig. 3. Changes in activity of reward-responsive dopamine neurons to changes in reward value.
a, b Population responses of reward-responsive dopamine neurons in Control (a) and HCx (b) groups. Left panels show changes in firing to reward delivery on the first (dark-blue) and last (light-blue) trials. Middle panels show changes in firing to reward omission on the first (dark-red) and last (light-red) trials. Right panels show the difference in firing between first and last trials in response to reward delivery (blue) and omission (red). c, e Distributions of difference scores comparing firing to unexpected reward delivery (left) and omission (right) in the early and late trials in control (c) and HCx (e) groups. The numbers in each panel indicate results of two-sided Wilcoxon singed-rank test (p) and the average difference score (u). d, f Average firing in response to reward delivery (black) and omission (gray) in the first 5 and last 5 trials in control (d) and HCx (f) groups. ANOVA (Reward x Early/Late x Trial) revealed significant main effects of Reward (Control, p = 8.0e-4; HCx, p = 9.8e-6) and Trial (Control, p = 0.039; HCx, p = 5.8e-4) in both control and HCx, and a significant interaction of Reward x Early/Late in control (F4,172 = 44.1, p = 1,1e-16), but not in HCx (p = 0.10). A step down in each plot revealed a significant main effect of Early/Late in reward delivery in both groups (control, p = 5.3e-6; HCx, p = 0.031) and reward omission in control (p = 3.9e-4), but not in HCx (p = 0.77). Significant effects are highlighted in red. Dashed lines indicate the baseline firing. Error bars, S.E.M.
Fig. 4
Fig. 4. Changes in reward-evoked activity of reward-responsive dopamine neurons to reward predictive odor cues.
a, c Average firing in response to high- (black) and low-valued (gray) cues in the first 5 and last 5 trials in control (a) and HCx (c) groups. ANOVA (group x value x early/late x trial) revealed a significant main effect of value (p = 2.1e-5) and significant interactions of value x early/late (p = 5.5e-4), value x trial (p = 0.0042), and value x early/late x trial (p = 0.033). Error bars, S.E.M. b, d Distributions of difference scores between high- and low-valued cues in early and late trials in control (b) and HCx (d) groups. The numbers in each panel indicate results of two-sided Wilcoxon singed-rank test (p) and the average difference score (u). Significant effects are highlighted in red.
Fig. 5
Fig. 5. Modeling the effect of hippocampal lesions as a blurring of transitions between trials.
a Conventional state space representation of the task. Possible transitions between states are depicted by arrows. Green arrows represent transitions available to the control model, while pink arrows represent transitions available to the lesion model. b The transition matrix (left panel) shows the probability of each successor state given each state, and the observation matrix (right panel) shows the probability of each observation given each state. The darker color indicates higher probabilities. Green and pink indicate the transitions available to the control and lesioned models, respectively. The characteristic observation is emitted with p = 0.95. States also emit a null (empty) observation (p = 0.05) or any of the other five possible observations (with p = 1e-4 each). The observation probabilities for each state were normalized by dividing their sum. c Simulated average prediction errors in the control model during the 2nd and 4th blocks. In the left panel, the black and gray lines represent the prediction error in response to reward delivery and reward omission, respectively. In the right panel, the dark and light lines represent the prediction error in response to the odor cue paired with high and low reward, respectively. d The same format as Fig. 5c, but for the lesion model. e Comparison of activities evoked by the 2nd drop of reward in the first 5 trials of the 3rd block in both animals and the model with a flat task space. The dopamine neurons in sham animals (n = 44) exhibit a higher response compared to the HCx animals (n = 66). In contrast, the model with a flat state space shows the opposite pattern (n = 20). Data in (ce) are presented as mean values +/− S.E.
Fig. 6
Fig. 6. Modeling the effect of hippocampal lesions as a blurring of transitions between blocks.
a Multi-level or hierarchical state space representation of the task. The upper-level (indicated by the dark blue box) contains the transition from intertrial interval to each block, with the trial start state in each block leading to the lower-level states (indicated by the light blue box), describing the state space of individual trials. Available transitions between states are marked by arrows. Dashed arrows indicated plastic transitions, whose probabilities are updated during learning. Solid arrows are transitions with fixed probabilities. b The transition probabilities among the upper-level states are updated according to reward history. The control model learns the transition probabilities perfectly and with low uncertainty (top panel), while the lesioned model has greater residual uncertainty (bottom panel). The darker color indicates higher probabilities. c Simulated average prediction errors in the control model during the 2nd and 4th blocks. In the left panel, the dark and light lines represent the prediction error in response to reward delivery and reward omission, respectively. In the right panel, the black and gray lines represent the prediction error in response to odor cues paired with high and low reward, respectively. d The same format as Fig. 6c, but for the lesion model. e Same format as Fig. 5e, but for the model with a hierarchical task space. The hierarchical model (n = 20) reproduces consistent error signal patterns with dopamine neuron activities. Data in ce are presented as mean values +/− S.E.
Fig. 7
Fig. 7. Reproduce the changes in dopamine neuron firing after OFC or ventral striatal lesions.
a, c As indicated by (a), to simulate an OFC lesion in the model, we fully eliminated the ability of the model to differentiate between states after actions by blurring transition probabilities between the odor cues and the corresponding well states and allowing the reward 1 state transit to either reward 2 state and intertrial interval state for both well in the third and fourth block. Possible transitions between states are depicted by arrows, and the darker color indicates higher probabilities; green arrows represent transitions available to the control model, while pink arrows represent transitions available to the lesion model. The model can account for the dopamine neurons’ response at the time of unexpected reward delivery (black lines, (c)) or omission (gray lines, (c)) in OFC lesion rats. Insert: Average firing of dopamine neurons after reward delivery (black lines) or omission (gray lines) in rats with OFC lesions. (b, d) Left panel in (b): Dwell-time distributions learned at the end of block 1 for the state left well in the short delay condition (blue) and state right well in the long delay condition (red) for the intact and VS lesion models. Right panel in (b): Dwell-time distributions learned at the end of block 3 for the state left well in the big reward condition (green) and state right well in the small reward condition (orange). By preventing the model from learning and using precise dwell time staying in each state, the model fails to learn the dwell-time distribution (b) and deduce unobservable transitions, resulting in no prediction error when the short reward is delivered (blue lines, (d)) or omitted unexpectedly (red lines, (d) and yellow lines, (d)), but the prediction error to the unexpected big reward delivery (green lines, (d)) remains intact. These results are consistent with the response patterns observed in dopamine neurons after ventral striatal lesions (inserts).

Update of

References

    1. O’Keefe J., Nadel L. The Hippocampus as a Cognitive Map. Clarendon Press (1978).
    1. Wilson, R. C., Takahashi, Y. K., Schoenbaum, G. & Niv, Y. Orbitofrontal cortex as a cognitive map of task space. Neuron81, 267–279 (2014). - PMC - PubMed
    1. Eichenbaum, H. Hippocampus: mapping or memory? Curr. Biol.10, R785–R787 (2000). - PubMed
    1. Tolman, E. C. Cognitive maps in rats and men. Psychological Rev.55, 189–208 (1948). - PubMed
    1. Behrens, T. E. et al. What is a cognitive map? organizing knowledge for flexible behavior. Neuron100, 490–509 (2018). - PubMed

Publication types

LinkOut - more resources