. 2024 Oct 17;15(1):8944.
doi: 10.1038/s41467-024-53354-7.

Spatiotemporal cerebral blood flow dynamics underlies emergence of the limbic-sensorimotor-association cortical gradient in human infancy

Affiliations

Spatiotemporal cerebral blood flow dynamics underlies emergence of the limbic-sensorimotor-association cortical gradient in human infancy

Minhui Ouyang et al. Nat Commun. .

Abstract

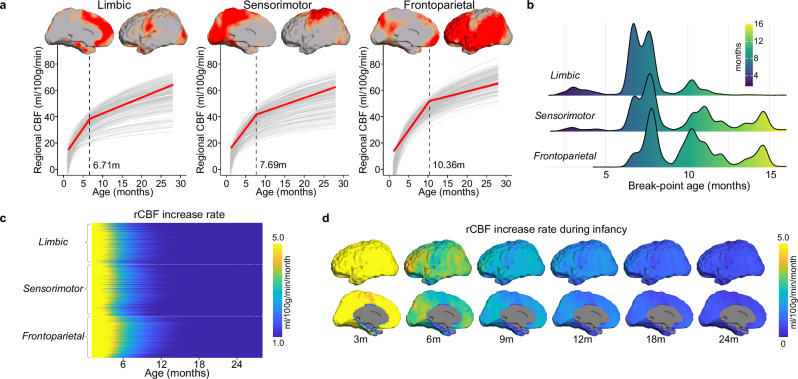
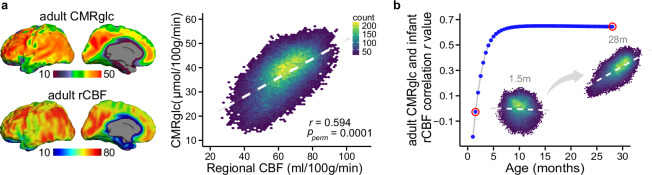
Infant cerebral blood flow (CBF) delivers nutrients and oxygen to fulfill brain energy consumption requirements for the fastest period of postnatal brain development across the lifespan. However, organizing principle of whole-brain CBF dynamics during infancy remains obscure. Leveraging a unique cohort of 100+ infants with high-resolution arterial spin labeled MRI, we find the emergence of the cortical hierarchy revealed by the highest-resolution infant CBF maps available to date. Infant CBF across cortical regions increases in a biphasic pattern featured by initial rapid and subsequently slower rate, and break-point ages increasing along the limbic-sensorimotor-association cortical gradient. Increases in CBF in sensorimotor cortices are associated with enhanced language and motor skills, and frontoparietal association cortices with cognitive skills. The study discovers emergence of the hierarchical limbic-sensorimotor-association cortical gradient in infancy and offers standardized reference of infant brain CBF and insight into the physiological basis of cortical specialization and real-world infant developmental functioning.


Conflict of interest statement

The authors declare no competing interests.

Figures

Fig. 1
Fig. 1. Developmental curve of global cerebral blood flow (CBF) throughout infancy.
Global CBF increases in a logarithmic manner during infancy (r = 0.823, p = 1.43 × 10−30, two-sided). The central line in red in the main panel demonstrates the best logarithmic fit of global CBF = 16.38 × log(age) + 16.85 (Supplementary Fig. 2 and Supplementary Table 2) using the statistical model of Eq. (3), with the 95% confidence interval of fitted curve indicated by light grey shading. Each of the data points (N = 119) represents global CBF of each infant measured with phase-contrast MRI. In the bottom-right panel, segmented regression analysis indicates a biphasic pattern of global CBF increase (red line) with a break point at 10.75 months. The fitted bilinear regression line was generated with segmented regression analysis (See “Methods” section). Source data are provided as a Source Data file.
Fig. 2
Fig. 2. Precise physiological variability at finer detail across infant brain regions.
Population-averaged regional cerebral blood flow (rCBF) maps in template space from infants age groups of 0–3, 3–6, 6–9, 9–12, 12–18, and 18–28 months. High-resolution (2.5 × 2.5 × 2.5 mm3) rCBF maps were acquired with 3D multi-shot, stack-of-spirals pseudo-continuous arterial spin labeled (pCASL) perfusion MRI. a Six representative axial slices of averaged rCBF maps from inferior to superior are shown from the left to right for each age group. b Averaged rCBF maps are projected to the 3D reconstructed surface of a template brain and displayed in lateral and medial view of both hemispheres. White, purple, and orange arrows indicate relatively higher CBF values in the primary sensorimotor, auditory and visual cortices, respectively, in younger age group.
Fig. 3
Fig. 3. Nonuniform age-related increases of regional CBF during infancy.
a Regional CBF increases in a logarithmic fashion across the cortex, most prominent in the heteromodal association cortex than unimodal cortex. Regional CBF increase is modeled for every cortical voxel using the statistical model of Eq. (4), with z > 5.1 indicating significant age effects after Bonferroni correction for multiple comparisons (Bonferroni corrected p < 0.05; two-sided). b Regional CBF increases vary heterogeneously by functional brain networks defined by Yeo et al., (2011) (top panel). The box plots in the bottom panel reflect the voxel-wise age effect of infant rCBF in seven functional networks ordered by median value. The centers of boxes are median values. Bounds of boxes are first and third quartile, with ends of whiskers representing the minima and maxima of non-outlier points of the distribution. Regional CBF increases most significantly with age in the fronto-parietal and default-mode networks, and less so in the limbic and sensorimotor networks. DA: dorsal attention (N = 13,730 voxels); DMN: default-mode network (N = 25,424 voxels); FPN: fronto-parietal network (N = 16,829 voxels); LIM: limbic (N = 7,641 voxels); SM: sensorimotor (N = 17,311 voxels); VA: ventral attention (N = 11,366 voxels); VIS: visual (N = 17,057 voxels). c The developmental curves of infant rCBF from representative voxels located in four brain networks: sensorimotor as SM-rep (upper-left panel), limbic as LIM-rep (bottom-left panel), fronto-parietal as FPN-rep (upper-right panel) and default-mode as DMN-rep (bottom-right panel). Voxel locations were indicated in (a). Each of the data points (N = 76) in a scatter plot represents rCBF measured with advanced pCASL for each infant. The red central lines indicate the best logarithmic fit of rCBF with the 95% confidence interval of fitted curves indicated by light grey shading. Source data are provided as a Source Data file.
Fig. 4
Fig. 4. Infant rCBF increases according to a hierarchical limbic-sensorimotor-association gradient.
a Cortical voxels were clustered into three groups (limbic, sensorimotor, and frontoparietal clusters) identified by non-negative matrix factorization (NMF) according to the pattern of rCBF increase over time. The respective locations of the three clusters on the cortical surface are displayed in lateral and medial views. Segmented regression analysis indicates a biphasic developmental pattern of averaged rCBF in each cluster (red line) overlaid on 200 randomly sampled voxel developmental curves from each cluster (gray thin lines). The identified break-point ages (black dashed lines) from segmented regression analysis varied across clusters and were provided at the bottom of each plot. b Histograms showed the profile of break-point age from cortical voxels within each cluster. c rCBF increase rate (ml/100 g/min/month) across cortical voxels within each cluster. d Heterogeneous rCBF increase rate across cortex at milestone ages during infancy. Slower and faster rCBF increase rates are shown in cool and warm colors, respectively. Source data are provided as a Source Data file.
Fig. 5
Fig. 5. Regionally specific rCBF increases are associated with developmental functioning in infants.
Of all cortical regions examined, the regions in red yellow showed significant positive associations (p corrected < 0.05, cluster with k > 100 voxels, t > 2.02) between rCBF in infants and their behavior and developmental functioning quantified with Bayley scales of infant and toddler development across domains of (a) motor, (b) language, and (c) cognitive. Associations in (ac) are modeled using the generalized additive model of Eq. (6). The identified three clusters across infant rCBF hierarchy are shown in different colors in (ac), with limbic in light yellow, sensorimotor in light green and frontoparietal in pink. Scatter plots in (ac) show the significant positive correlations between infant’s behavioral scores and the averaged rCBF values from the largest, blue circled clusters (Bonferroni corrected p < 0.05; two-sided). The solid central line in the scatter plot of (ac) indicates the best linear fit with the 95% confidence interval of fitted line demonstrated by light gray shading. d River plot shows spatial distribution of voxels with significant association of each score across the identified rCBF hierarchy. Ribbons are normalized by the total number of voxels with significant associations in each behavioral score, shown in a different color. LIM limbic; SM sensorimotor; FP frontoparietal; L/R left/right hemisphere; ANG angular gyrus; CingG cingulate gyrus; Fu fusiform gyrus; Hippo hippocampus; IOG inferior occipital gyrus; ITG inferior temporal gyrus; LFOG lateral fronto-orbital gyrus; LG lingual gyrus; MFG middle frontal gyrus; MFOG medial fronto-orbital gyrus; MOG middle occipital gyrus; MTG middle temporal gyrus; PoCG postcentral gyrus; PrCG precentral gyrus; SFG superior frontal gyrus; SOG superior occipital gyrus; SPG superior parietal lobule. Source data are provided as a Source Data file.
Fig. 6
Fig. 6. Infant rCBF reorganized by spatiotemporally varying energy demand for brain maturation.
a The upper-left panel shows the adult cerebral metabolic rate of glucose (CMRglc) map, acquired from published average maps across 28 healthy adults from Shokri-Kojori et al. (2019). The adult CMRglc map highlights frontal lobe and precuneus as the most metabolically demanding regions. The bottom-left panel shows the rCBF map acquired from a healthy adult using the same scanner and identical pCASL protocol as the infant cohort. Shown in the right panel, adult rCBF significantly correlated with the adult CMRglc (r = 0.594, pperm = 0.0001; Pearson correlation with permutation test; two-sided). b Spatial distribution of infant rCBF map is progressively reorganized during development and gradually aligns with the adult CMRglc distribution pattern. Spatial alignment between fitted infant rCBF map from 1 to 28 months (m) and adult CMRglc slowly increases, reaching a plateau at 10 m of age. RCBF-CMRglc associations at two representative ages (red circled) of 1.5 and 28 months are also shown. Unlikely the weak association between 1.5 m infant rCBF and adult CMRglc maps, the distribution of 28 m infant rCBF is highly aligned with the adult metabolic distribution map. Source data are provided as a Source Data file.

Update of

References

    1. Bethlehem, R. A. I. et al. Brain charts for the human lifespan. Nature604, 525–533 (2022). - PMC - PubMed
    1. Ouyang, M., Dubois, J., Yu, Q., Mukherjee, P. & Huang, H. Delineation of early brain development from fetuses to infants with diffusion MRI and beyond. Neuroimage185, 836–850 (2019). - PMC - PubMed
    1. Attwell, D. et al. Glial and neuronal control of brain blood flow. Nature468, 232–243 (2010). - PMC - PubMed
    1. Kennedy, C. & Sokoloff, L. An adaptation of the nitrous oxide method to the study of the cerebral circulation in children; normal values for cerebral blood flow and cerebral metabolic rate in childhood. J. Clin. Investig.36, 1130–1137 (1957). - PMC - PubMed
    1. Kuzawa, C. W. et al. Metabolic costs and evolutionary implications of human brain development. Proc. Natl Acad. Sci. USA111, 13010–13015 (2014). - PMC - PubMed

Publication types

LinkOut - more resources