. 2024 Oct 16;14(1):24315.
doi: 10.1038/s41598-024-74874-8.

Key genes and immune pathways in T-cell mediated rejection post-liver transplantation identified via integrated RNA-seq and machine learning

Affiliations

Key genes and immune pathways in T-cell mediated rejection post-liver transplantation identified via integrated RNA-seq and machine learning

Wenhao Shao et al. Sci Rep. .

Abstract

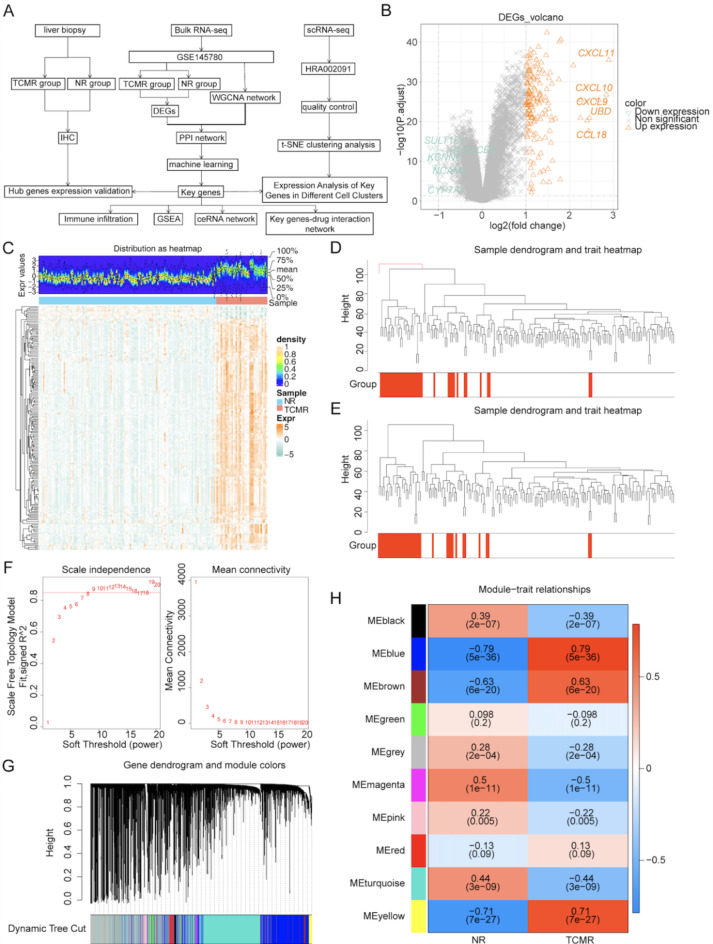
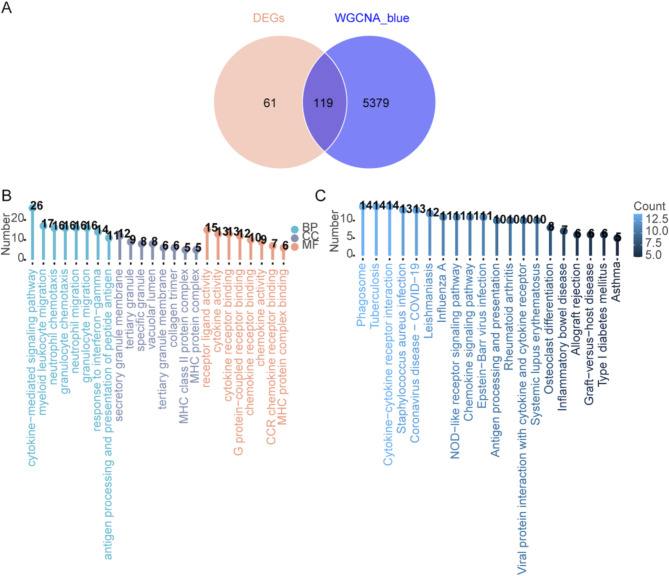
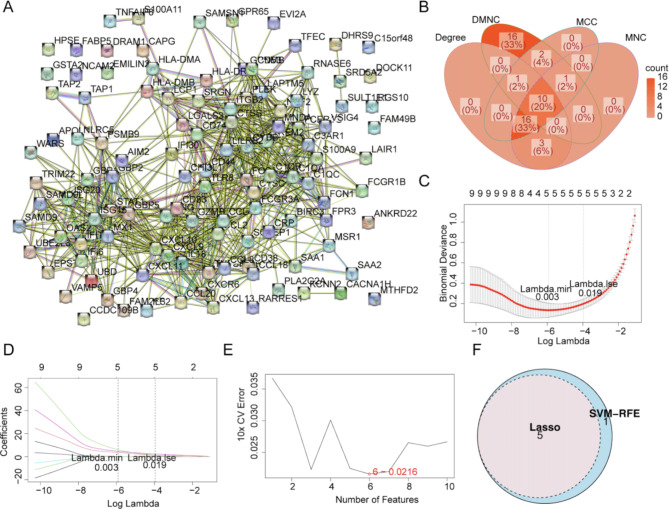
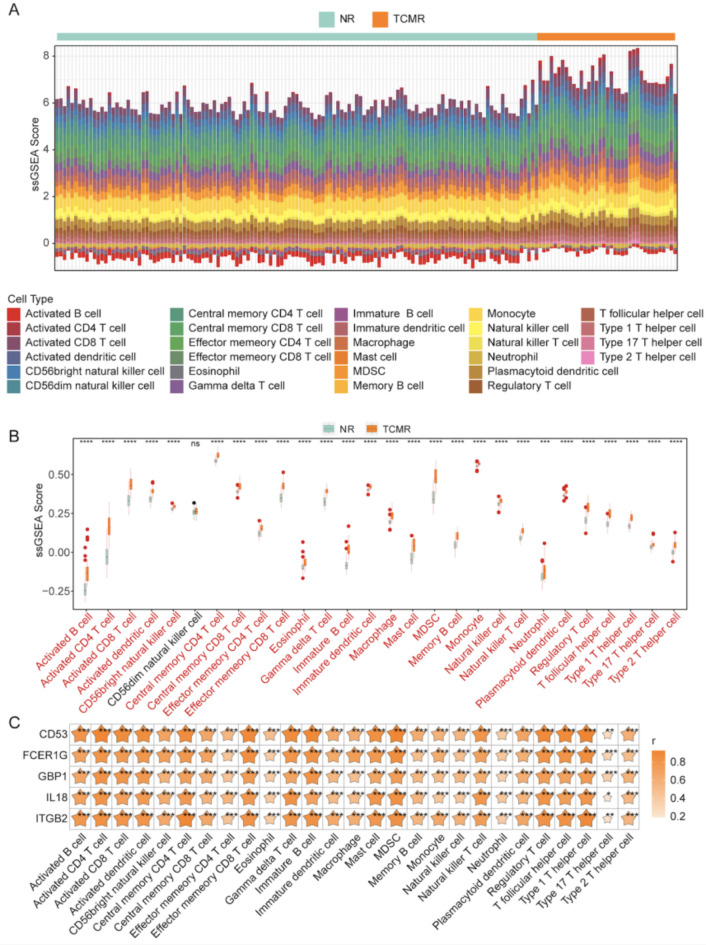
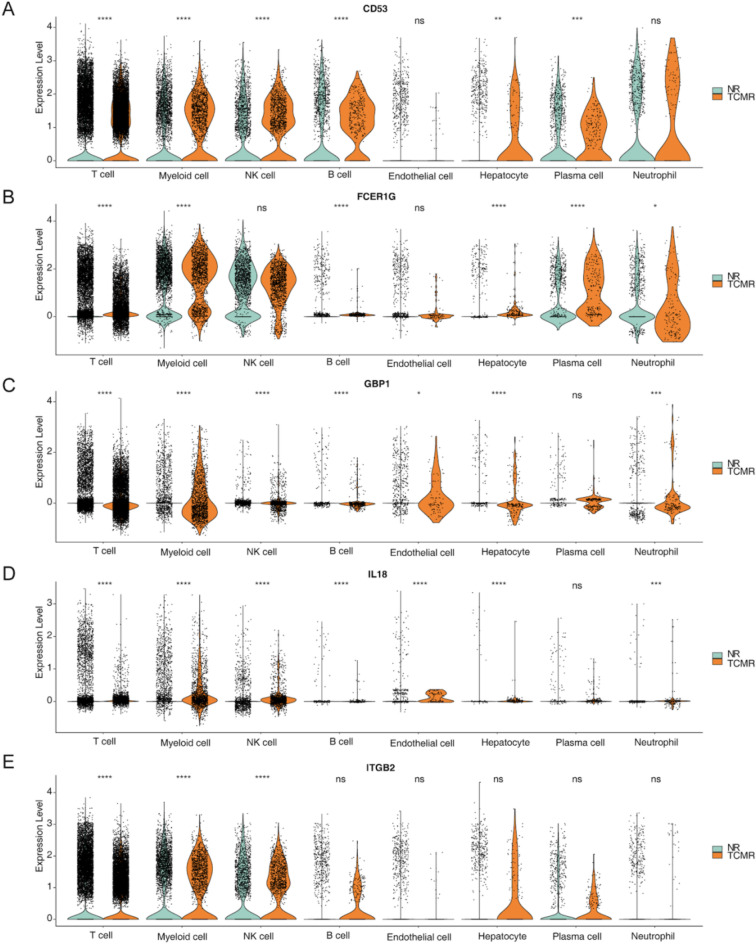
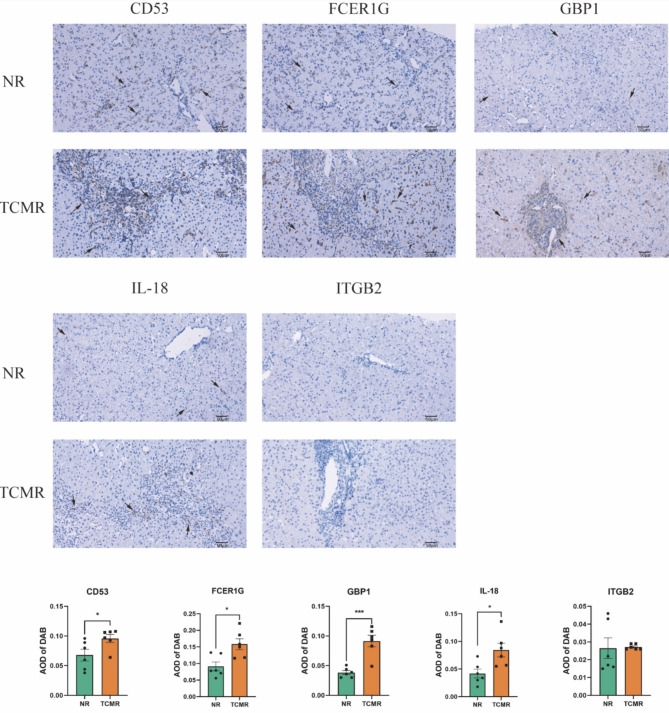
Liver transplantation is the definitive treatment for end-stage liver disease, yet T-cell mediated rejection (TCMR) remains a major challenge. This study aims to identify key genes associated with TCMR and their potential biological processes and mechanisms. The GSE145780 dataset was subjected to differential expression analysis, weighted gene co-expression network analysis (WGCNA), and machine learning algorithms to pinpoint key genes associated with TCMR. Gene Set Enrichment Analysis (GSEA), immune infiltration analysis, and regulatory networks were constructed to ascertain the biological relevance of these genes. Expression validation was performed using single-cell RNA-seq (scRNA-seq) data and liver biopsy tissues from patients. We identified 5 key genes (ITGB2, FCER1G, IL-18, GBP1, and CD53) that are associated with immunological functions, such as chemotactic activity, antigen processing, and T cell differentiation. GSEA highlighted enrichment in chemokine signaling and antigen presentation pathways. A lncRNA-miRNA-mRNA network was delineated, and drug target prediction yielded 26 potential drugs. Evaluation of expression levels in non-rejection (NR) and TCMR groups exhibited significant disparities in T cells and myeloid cells. Tissue analyses from patients corroborated the upregulation of GBP1, IL-18, CD53, and FCER1G in TCMR cases. Through comprehensive analysis, this research has identified 4 genes intimately connected with TCMR following liver transplantation, shedding light on the underlying immune activation pathways and suggesting putative targets for therapeutic intervention.

Keywords: Enrichment analysis; Immune analysis; Liver transplant rejection; Single-cell RNA sequencing; T-cell mediated rejection.


Conflict of interest statement

The authors declare no competing interests.

Figures

Fig. 1
Fig. 1
Identification of differentially expressed genes (DEGs) and key module genes. (A) The workflow of the study. (BC) Volcano plot and heatmap of DEGs; Orange represents upregulated genes, gray represents genes with no significant difference, and green represents downregulated genes. (D) The sample clustering diagram shows an outlier sample; red represents T-cell-mediated rejection (TCMR) samples and white represents no rejection (NR) samples. (E) Re-cluster after removing outlier samples. (F) Analysis of network topology for various soft-threshold powers. (G) Clustering dendrogram of DEGs, genes are divided into different modules. (H) Heatmap of module-trait correlations. Each gene depicts the correlation coefficients and p-values. Genes are colored according to correlation intensity: red for positive and blue for negative, as per the color legend.
Fig. 2
Fig. 2
Definition and functional analysis of DEGs associated with liver transplant rejection reactions (LTR-DEGs). (A) Venn diagram illustrates LTR-DEGs by overlapping DEGs and key module genes. (B) Lollipop diagram of LTR-DEGs’ Gene Ontology (GO) enrichment analysis. BP: biological process. CC: cellular components. MF: molecular functions. (C) Lollipop diagram of LTR-DEGs’ Kyoto Encyclopedia of Genes and Genomes (KEGG) pathway enrichment analysis, displaying the 20 most significantly different pathways.
Fig. 3
Fig. 3
Construction of the Protein-Protein Interaction (PPI) network and key gene screening. (A) The nodes indicate proteins, and the letters represent gene symbols. (B) A Venn diagram illustrates candidate genes by overlapping the hub genes of the 4 algorithms. (C, D) The results of least absolute shrinkage and selection operator (LASSO) COX regression analysis. The dotted line on the left indicates the position with the smallest cross-validation error. At this position (Lambda.min), one identifies the corresponding log (Lambda) value on the horizontal axis. The upper horizontal axis displays the number of feature genes to find the optimal log (Lambda) value, identifying the relevant genes and their coefficients, and explaining the proportion of residuals in the model. (E) When the gene count is six, the error rate is at its lowest. (F) Venn diagram illustrates key genes by overlapping the results of two machine algorithms.
Fig. 4
Fig. 4
Immune cell profiling in TCMR and NR groups. (A) Bar graph of immune scores for 28 immune cell types between TCMR and NR groups. (B) Comparative scoring of 28 immune cell types in two groups of samples. (C) Correlation between key genes and immune cells, the x-axis represents immune cells, and the y-axis represents biomarkers. *p < 0.05, **p < 0.01, ***p < 0.001, ****p < 0.0001, ns: p > 0.05.
Fig. 5
Fig. 5
Networks of key genes-drug interaction and lncRNA-miRNA-mRNA. (A) Drug-target network diagram for key genes, with green rectangles representing drugs and red shapes representing key genes. (B) lncRNA-miRNA-mRNA network diagram, where red triangles represent mRNAs, green circles represent miRNAs, and blue rectangles represent lncRNAs. Red lines in the diagram indicate interactions between miRNAs and mRNAs, while grey lines indicate interactions between lncRNAs and miRNAs.
Fig. 6
Fig. 6
Cell clustering analysis of single-cell RNA sequence (scRNA-seq) data. (A) Red dots represent high-variability genes, and black dots represent invariant genes; the greater the height on the y-axis, the larger the variance and difference of the genes. The names of the top 10 high-variability genes are also displayed. (B) t-distributed stochastic neighborhood embedding (t-SNE) plot colored by different cell clusters. (C) Bubble chart of classic marker genes for each cell group. (D) t-SNE plot of cell clustering annotation results. (E) Cell clustering annotation results (NR group). (F) Cell clustering annotation results (TCMR group). (G) Proportion of each cell group among all cells.
Fig. 7
Fig. 7
Expression differences of key genes across various cell groups. (A) Expression level differences of CD53 across different cell groups. (B) Expression level differences of FCER1G across different cell groups. (C) Expression level differences of GBP1 across different cell groups. (D) Expression level differences of IL-18 across different cell groups. (E) Expression level differences of ITGB2 across different cell groups.
Fig. 8
Fig. 8
Immunohistochemical staining of key genes in liver biopsy tissue.

References

    1. Starzl, T. E. et al. Homotransplantation of the liver in humans. Surg. Gynecol. Obstet.117, 659–676 (1963). - PMC - PubMed
    1. Rossi, M. et al. Liver transplantation. J. Ultrasound10, 28–45. 10.1016/j.jus.2007.02.006 (2007). - PMC - PubMed
    1. Borel, J. F., Feurer, C., Gubler, H. U. & Stähelin, H. Biological effects of cyclosporin A: A new antilymphocytic agent. Agents Actions6, 468–475. 10.1007/bf01973261 (1976). - PubMed
    1. Kim, W. et al. OPTN/SRTR 2016 Annual Data Report: liver. Am. J. Transplant. 172–253. 10.1111/ajt.14559 (2018). - PubMed
    1. Jadlowiec, C. et al. Not all cellular rejections are the same: Differences in early and late hepatic allograft rejection. Liver Transplant.25, 425–435. 10.1002/lt.25411 (2019). - PubMed