. 2024 Dec;27(12):2500-2511.
doi: 10.1038/s41593-024-01787-0. Epub 2024 Oct 16.

Integrating brainstem and cortical functional architectures

Affiliations

Integrating brainstem and cortical functional architectures

Justine Y Hansen et al. Nat Neurosci. 2024 Dec.

Abstract

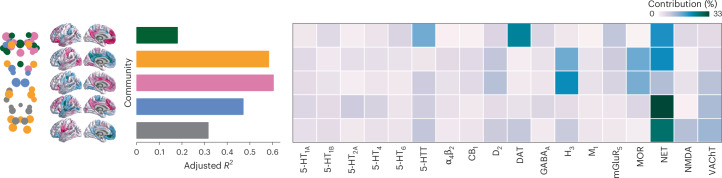
The brainstem is a fundamental component of the central nervous system, yet it is typically excluded from in vivo human brain mapping efforts, precluding a complete understanding of how the brainstem influences cortical function. In this study, we used high-resolution 7-Tesla functional magnetic resonance imaging to derive a functional connectome encompassing cortex and 58 brainstem nuclei spanning the midbrain, pons and medulla. We identified a compact set of integrative hubs in the brainstem with widespread connectivity with cerebral cortex. Patterns of connectivity between brainstem and cerebral cortex manifest as neurophysiological oscillatory rhythms, patterns of cognitive functional specialization and the unimodal-transmodal functional hierarchy. This persistent alignment between cortical functional topographies and brainstem nuclei is shaped by the spatial arrangement of multiple neurotransmitter receptors and transporters. We replicated all findings using 3-Tesla data from the same participants. Collectively, this work demonstrates that multiple organizational features of cortical activity can be traced back to the brainstem.


Conflict of interest statement

Competing interests: The authors declare no competing interests.

Figures

Fig. 1
Fig. 1. Brainstem–cortex FC.
a, Coronal (posterior view), saggital and axial view of the thresholded (35%) probabilistic template for all 58 brainstem nuclei in the Brainstem Navigator atlas (https://www.nitrc.org/projects/brainstemnavig/ (ref. )). b, Coronal (posterior view), saggital and axial view of cortical (gray points, n = 400) and brainstem (green points, n = 58) parcel coordinate centroids. c, Left, FC matrix (458 regions × 458 regions). Right, FC matrix between cortex and brainstem (400 cortical regions × 58 brainstem nuclei). d, Density distributions of FC within brainstem (green), between brainstem and cortex (blue) and within cortex (pink). e, Scatter plot of FC between regions as a function of Euclidean distance between parcel centroids. Within-cortex two-sided Spearman’s r = −0.29, P ≈ 0; brainstem–cortex two-sided Spearman’s r = 0.05, P = 8.7 × 10−16; within-brainstem two-sided Spearman’s r = −0.11, P = 3.4 × 10−6.
Fig. 2
Fig. 2. Dominant patterns of brainstem–cortex FC.
a, Brainstem-to-cortex weighted degree is calculated by summing a brainstem nucleusʼ FC across all cortical regions. Coronal (posterior view), sagittal and axial perspectives of brainstem nuclei are shown. Node size and color reflect weighted degree, and edges are plotted for the 5% strongest functional connections within the brainstem (see Supplementary Fig. 22 for 2.5% and 10% strongest edges). Key brainstem nuclei are labeled. b, Cortex-to-brainstem weighted degree was calculated by summing a cortical region’s FC across all brainstem nuclei. Color bar ranges from the 2.5th to 97.5th percentiles of the data. c, Cortex-to-brainstem weighted degree binned according to classes of laminar differentiation (groups are significantly different from one another; one-way ANOVA F = 18.5, P = 2.8 × 10−11),. Classes: paralimbic (n = 61), heteromodal (n = 136), unimodal (n = 120) and idiotypic (n = 3). d, Cortex-to-brainstem weighted degree binned according to classes of cytoarchitecture (groups are significantly different from one another; one-way ANOVA F = 35.6, P = 2.0 × 10−34),. Classes: insula (n = 16), limbic (n = 39), association network 1 (n = 155), association network 2 (n = 77), primary/secondary sensory (n = 64), primary motor (n = 26) and primary sensory (n = 23). Violin plots in c and d estimate a kernel density on the underlying data, where the underlying data are the weighted degree of each cortical region in the bin. The green point indicates the median, and the vertical line indicates the quartiles of the distribution. e, Scatter plots are shown for the correlation between cortex-to-brainstem weighted degree and seven metrics of MEG dynamics: power spectrum distributions for six canonical frequency bands and the intrinsic timescale (temporal memory of a neural element; see Methods for details); each point is a brain region (n = 400). Cortical distributions of MEG measures are shown on the brain surface below each plot and are derived from data in the HCP.
Fig. 3
Fig. 3. Brainstem communities underlying cortical function.
The Louvain community detection algorithm was applied to determine whether brainstem nuclei can be organized into distinct communities that make specific connectivity patterns with the cortex. a, Left, for all 458 nodes (400 cortical and 58 brainstem), we correlated (Spearmanʼs r) the node’s brainstem FC profile with the weighted degree pattern shown in the inset and in Fig. 2a. The density distribution of Spearman’s r for brainstem (green) and cortical (pink) nodes is shown separately as well as together (blue) (median r = 0.97). Middle, this brainstem map (weighted degree of brainstem-to-cortex FC) is regressed out of each cortical region’s brainstem FC pattern, resulting in a matrix (400 cortical regions × 58 brainstem nuclei) of FC residuals. Right, correlation matrix representing how similarly (Spearman’s r) two brainstem nuclei are functionally connected with the cortex, above and beyond the dominant pattern of connectivity between brainstem and cortex. Brainstem nuclei are ordered according to community affiliation (community colors shown on the right), and communities are outlined within the heatmap. Brackets on the right indicate how communities are joined in coarser community detection solutions. b, Community assignments from the Louvain community detection algorithm. Coronal (posterior view), sagittal and axial perspectives of brainstem nuclei are shown. Node size is proportional to weighted degree shown in Fig. 2a. See Table 1 for a list of all brainstem nuclei organized by community affiliation. c, Cortical weighted degree patterns were calculated as the sum of a cortical region’s FC with all brainstem nuclei within a specific community and are shown for all five communities. These maps represent how each brainstem community is functionally connected with the cortex. d, Each cortical weighted degree pattern in c was correlated with 123 cognitive and behavioral meta-analytic activation maps from Neurosynth. Only the top 10% correlations are shown. Correlation coefficients for the full set of Neurosynth terms can be found in Supplementary Fig. 8.
Fig. 4
Fig. 4. Mapping chemoarchitecture to brainstem communities.
For each community (shown on the brainstem plot on the left as well as in Fig. 3b), a multiple linear regression model was fitted between 18 cortical neurotransmitter receptor and transporter density profiles and the community’s cortical weighted degree pattern (shown as surface plots as well as in Fig. 3c). Model fits (adjusted R2) are shown in the bar plot. Dominance analysis was applied to the independent variables (receptors and transporters) to determine which receptors/transporters were contributing most to the model fit. Percent contribution is shown in the heatmap. Receptor/transporter data were acquired from a PET atlas of neurotransmitter receptor/transporter densities in the human brain,.
Fig. 5
Fig. 5. Brainstem nuclei delineate unimodal and transmodal cortical regions.
a, Left, FC residuals (identical to the matrix shown on the left in Fig. 3a). Right, correlation matrix representing how similarly (Spearman’s r) two cortical regions are functionally connected with the brainstem above and beyond the dominant pattern of brainstem–cortex connectivity. b, Diffusion map embedding was applied to the matrix shown in a. Left, the first gradient of cortex–brainstem FC. Right, correlation between the first gradient of cortex–brainstem connectivity and the first gradient of cortex–cortex FC (also called the cortical functional hierarchy, the unimodal–transmodal axis and the sensory–association axis; r = 0.77, Pspin = 0.0001). Distribution of gradient values are shown for both gradients. c, Brainstem weighted degree patterns were calculated as the sum of a brainstem nucleusʼ FC with all negatively (left) or positively (right) scored regions of the cortical gradient shown in b. Coronal (posterior view), sagittal and axial perspectives of brainstem nuclei are shown. Node size is proportional to weighted degree shown in Fig. 2a.

Update of

References

    1. Beissner, F. Functional MRI of the brainstem: common problems and their solutions. Clin. Neuroradiol.25, 251–257 (2015). - PubMed
    1. Kanwisher, N. Functional specificity in the human brain: a window into the functional architecture of the mind. Proc. Natl Acad. Sci. USA107, 11163–11170 (2010). - PMC - PubMed
    1. Yeo, B. T. et al. The organization of the human cerebral cortex estimated by intrinsic functional connectivity. J. Neurophysiol.106, 1125–1165 (2011). - PMC - PubMed
    1. Smith, S. M. et al. Correspondence of the brain’s functional architecture during activation and rest. Proc. Natl Acad. Sci. USA106, 13040–13045 (2009). - PMC - PubMed
    1. Assem, M., Glasser, M. F., van Essen, D. C. & Duncan, J. A domain-general cognitive core defined in multimodally parcellated human cortex. Cereb. Cortex30, 4361–4380 (2020). - PMC - PubMed

LinkOut - more resources