. 2024 Oct 16;7(1):1303.
doi: 10.1038/s42003-024-06905-z.

Structure of endothelin ETB receptor-Gi complex in a conformation stabilized by unique NPxxL motif

Affiliations

Structure of endothelin ETB receptor-Gi complex in a conformation stabilized by unique NPxxL motif

Kazutoshi Tani et al. Commun Biol. .

Abstract

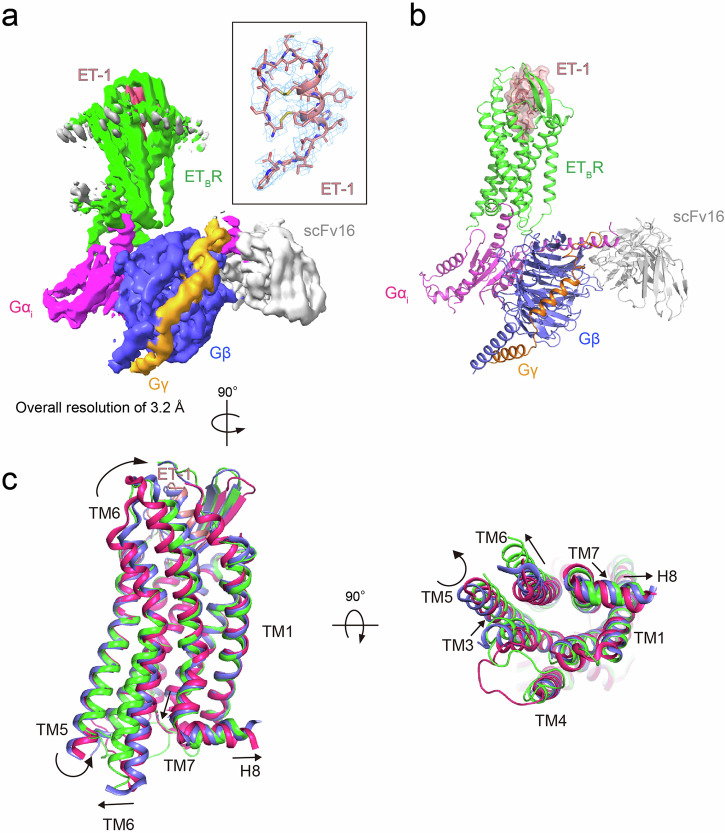
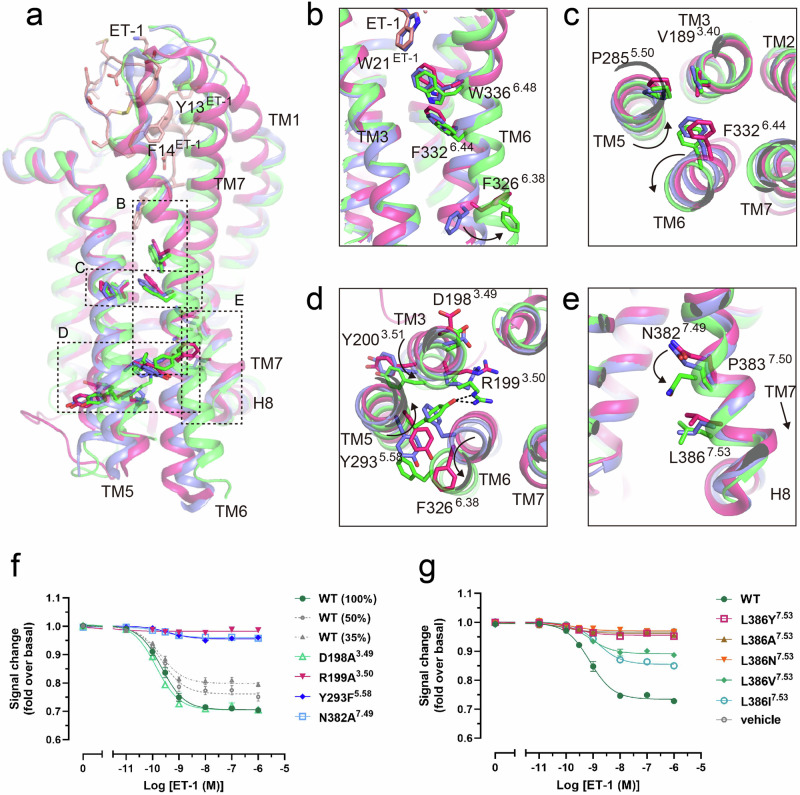
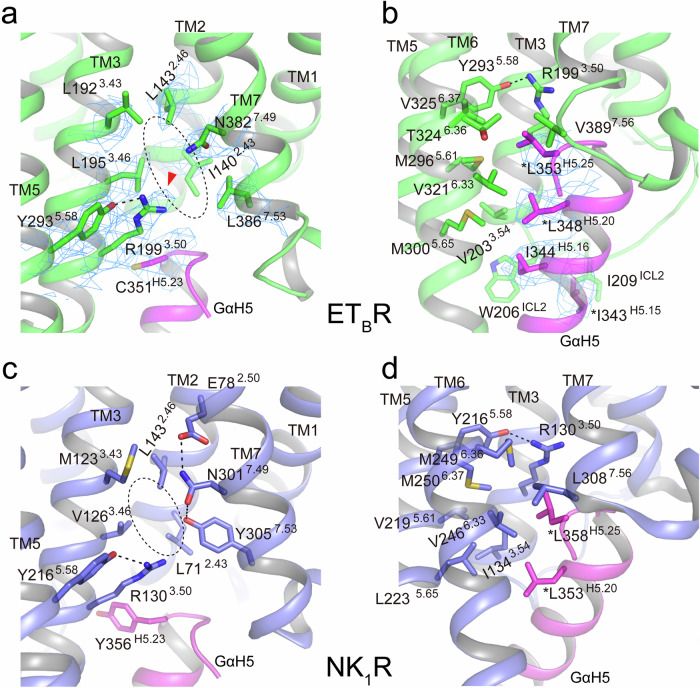
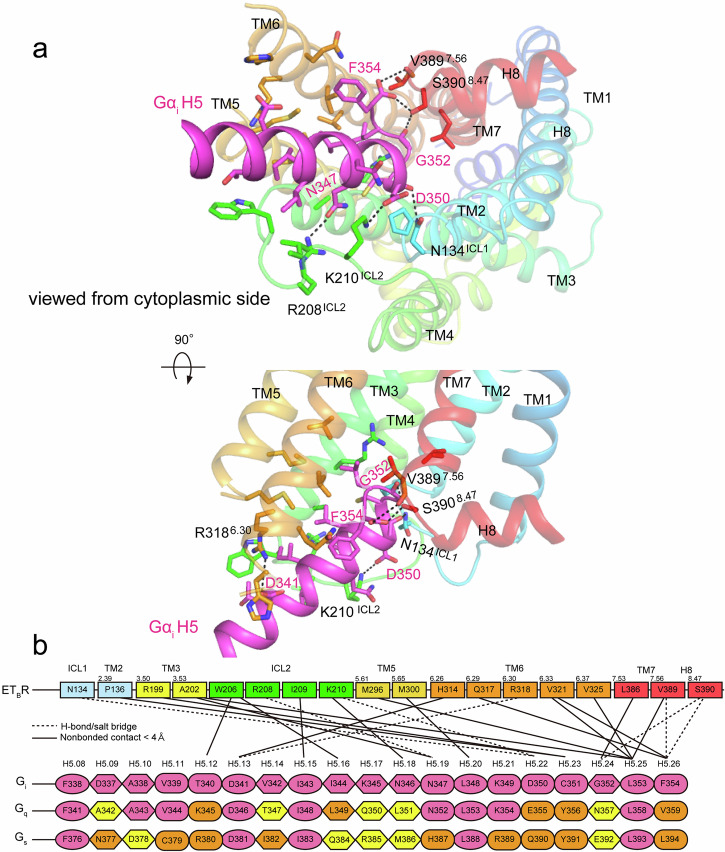
Endothelin type B receptor (ETBR) plays a crucial role in regulating blood pressure and humoral homeostasis, making it an important therapeutic target for related diseases. ETBR activation by the endogenous peptide hormones endothelin (ET)-1-3 stimulates several signaling pathways, including Gs, Gi/o, Gq/11, G12/13, and β-arrestin. Although the conserved NPxxY motif in transmembrane helix 7 (TM7) is important during GPCR activation, ETBR possesses the lesser known NPxxL motif. In this study, we present the cryo-EM structure of the ETBR-Gi complex, complemented by MD simulations and functional studies. These investigations reveal an unusual movement of TM7 to the intracellular side during ETBR activation and the essential roles of the diverse NPxxL motif in stabilizing the active conformation of ETBR and organizing the assembly of the binding pocket for the α5 helix of Gi protein. These findings enhance our understanding of the interactions between GPCRs and G proteins, thereby advancing the development of therapeutic strategies.


Conflict of interest statement

The authors declare no competing interests.

Figures

Fig. 1
Fig. 1. Cryo-EM structure of the ET-1–ETBR–DNGi complex.
a Cryo-EM density map of the ET-1–ETBR–DNGi–scFv16 complex. Green: ETBR, salmon: ET-1, magenta: DNGαi Ras-like domain, blue: Gβ, orange: Gγ, and gray: scFv16. The inset shows the ET-1 model with the corresponding density at a contour level of 4.0 σ. b Molecular model of the ET-1–ETBR–DNGi complex in the same view and color scheme as in a. c Comparison of the Gi-stabilized active state of ET-1–ETBR (green), partially active state of ET-1–ETBR (blue), and bosentan-bound inactive ETBR (red). Black arrows represent helical movements from inactive to active state of ETBR.
Fig. 2
Fig. 2. Gi-coupled ETBR is in an active conformation.
a Superposition of the Gi-bound ETBR structure (green) with the partially active-state crystal structure of ET-1-bound ETBR (blue) and the inactive-state crystal structure of the antagonist bosentan-bound ETBR (magenta). be Close-up views of conserved motifs involved in receptor activation. Arrows indicate the repositioning of side chains from the inactive to active state. f, g Concentration–response curves for ET-1-induced Gi signaling activity in the NanoBiT G-protein dissociation assay of ETBR–wild-type (WT) and mutant receptors. Symbols and error bars represent mean and standard error of the mean (SEM), respectively, from three independent experiments, each performed in duplicate or triplicate. Signaling of reduced amounts of WT ETBR (% of plasmid DNA transfected) for Gi is shown in gray. Data for these figures and expression levels of WT and mutant receptors measured by [125I]ET-1 binding are shown in Supplementary Fig. 8 and Table 1a, b.
Fig. 3
Fig. 3. Hydrophobic interactions between ETBR and NK1R in the active state.
Hydrophobic interactions around R3.50 and L/Y7.53 of ETBR (a, b) and NK1R (c, d), respectively. a The downward motion of TM7 of ETBR is stabilized by N3827.49 and L3867.53 in the NPxxL motif through a series of hydrophobic interactions with I1402.43, L1953.46, etc. The density around all rendered residues at a contour level of 5.0 σ is shown as a mesh. b The large hydrophobic side chains of L348H5.20 and L353H5.25 of Gαi penetrate deeply into the hydrophobic pocket formed by TM3, TM5, TM6, and TM7 of ETBR. I343H5.15 and I344H5.16 form additional interactions with ICL2. The density around the rendered residues of the α5 helix of Gαi is shown as a mesh at a contour level of 5.0 σ. c The downward motion of TM7 of NK1R is stabilized by E782.50, N3017.49, and Y3057.53 in NPxxY through a series of hydrogen-bond interactions as well as hydrophobic interactions with L712.43, V1263.46, etc. d The large hydrophobic side chains of L353H5.20 and L358H5.25 of Gαq penetrate deeply into the hydrophobic pocket formed by TM3, TM5, TM6, and TM7 of NK1R. Identical residues among Gi, Go, and Gs are denoted by “*” before the amino acid label, but a conserved residue (L348H5.15 of Gαq) in d was omitted because it does not contact the receptor. The NPxxL motif leads to the formation of a larger cavity than NPxxY (indicated by a dashed oval).
Fig. 4
Fig. 4. Interface between ETBR and Gαi.
a Close-up view of the interaction between ETBR and the α5 helix of Gαi. Hydrogen bonds are indicated by black dotted lines. b Schematic representation of direct contacts between ETBR and the α5 helix of Gαi. Hydrogen-bonded and hydrophobic contacts are indicated by dashed and solid lines, respectively. Receptor residues involved in hydrogen bonding are numbered according to Ballesteros–Weinstein numbering, and Gαi residues involved in hydrogen bonding are numbered according to CGN numbering. Gαi and conserved Gαq and Gαs residues are in magenta, homologous residues of Gαq and Gαs are in orange, and others are shown in yellow.
Fig. 5
Fig. 5. Validation of the interface residues of the ETBR–Gi complex in the NanoBiT Gi-protein dissociation assay.
Symbols and error bars represent mean and standard error of the mean (SEM), respectively, from three independent experiments, each performed in duplicate or triplicate. ac The replaced interface residues of ETBR were examined. Data for these figures and the expression levels of WT and mutant receptors are shown in Supplementary Table 1c–e. d The replaced interface residues of Gαi were examined. Mutant Gi show luminescence counts comparable with those of WT. Data for this figure are shown in Supplementary Table 1f.
Fig. 6
Fig. 6. Intermolecular and intramolecular interactions observed in MD simulations.
a Hydrogen-bond interactions in each run are represented by red lines. b Water densities in the cavity formed by transmembrane regions TM3, TM6, and TM7 in run 1 are superposed on the initial structure. Time evolution of distances between R1993.50 and N3827.49 (c) and between L1953.46 and L3867.53 (d) are shown. Distances were calculated as the minimum distance between all possible pairs of heavy atoms of two residues.

References

    1. Kedzierski, R. M. & Yanagisawa, M. Endothelin system: The double-edged swords in health and disease. Annu. Rev. Pharmacol. Toxicol.41, 851–876 (2001). - PubMed
    1. Davenport, A. P. et al. Endothelin. Phamacol. Rev.68, 357–418 (2016). - PMC - PubMed
    1. Barton, M. & Yanagisawa, M. Endothelin: 30 years from discovery to therapy. Hypertension74, 1232–1265 (2019). - PubMed
    1. Enevoldsen, F. C. et al. Endothelin receptor antagonists: status quo and future perspectives for targeted therapy. J. Clin. Med.9, 824 (2020). - PMC - PubMed
    1. Ranjan, A. K. & Gulati, A. Sovateltide mediated endothelin B receptors agonism and curbing neurological disorders. Int. J. Mol. Sci.23, 3146 (2022). - PMC - PubMed

MeSH terms

Substances