. 2024 Nov;635(8039):679-689.
doi: 10.1038/s41586-024-08002-x. Epub 2024 Oct 16.

A prenatal skin atlas reveals immune regulation of human skin morphogenesis

Nusayhah Hudaa Gopee #  1   2 Elena Winheim #  3 Bayanne Olabi #  1   2 Chloe Admane  1   3 April Rose Foster  3 Ni Huang  3 Rachel A Botting  1 Fereshteh Torabi  3 Dinithi Sumanaweera  3 Anh Phuong Le  4   5   6 Jin Kim  4   5   6 Luca Verger  7 Emily Stephenson  1   3 Diana Adão  3 Clarisse Ganier  8 Kelly Y Gim  4   5   6 Sara A Serdy  4   5   6 CiCi Deakin  4   5   6 Issac Goh  1   3 Lloyd Steele  3 Karl Annusver  9 Mohi-Uddin Miah  1 Win Min Tun  1   3 Pejvak Moghimi  3 Kwasi Amoako Kwakwa  3 Tong Li  3 Daniela Basurto Lozada  1 Ben Rumney  3 Catherine L Tudor  3 Kenny Roberts  3 Nana-Jane Chipampe  3 Keval Sidhpura  1 Justin Englebert  1 Laura Jardine  1 Gary Reynolds  1 Antony Rose  1   3 Vicky Rowe  3 Sophie Pritchard  3 Ilaria Mulas  3 James Fletcher  1 Dorin-Mirel Popescu  1 Elizabeth Poyner  1   2 Anna Dubois  2 Alyson Guy  10 Andrew Filby  1 Steven Lisgo  1 Roger A Barker  11 Ian A Glass  12 Jong-Eun Park  3 Roser Vento-Tormo  3 Marina Tsvetomilova Nikolova  13 Peng He  3   14 John E G Lawrence  3 Josh Moore  15 Stephane Ballereau  3 Christine B Hale  3 Vijaya Shanmugiah  3 David Horsfall  1 Neil Rajan  1   2 John A McGrath  16 Edel A O'Toole  17 Barbara Treutlein  13 Omer Bayraktar  3 Maria Kasper  9 Fränze Progatzky  7 Pavel Mazin  3 Jiyoon Lee  4   5   6 Laure Gambardella  3 Karl R Koehler  18   19   20 Sarah A Teichmann  21 Muzlifah Haniffa  22   23   24
Affiliations

A prenatal skin atlas reveals immune regulation of human skin morphogenesis

Nusayhah Hudaa Gopee et al. Nature. 2024 Nov.

Abstract

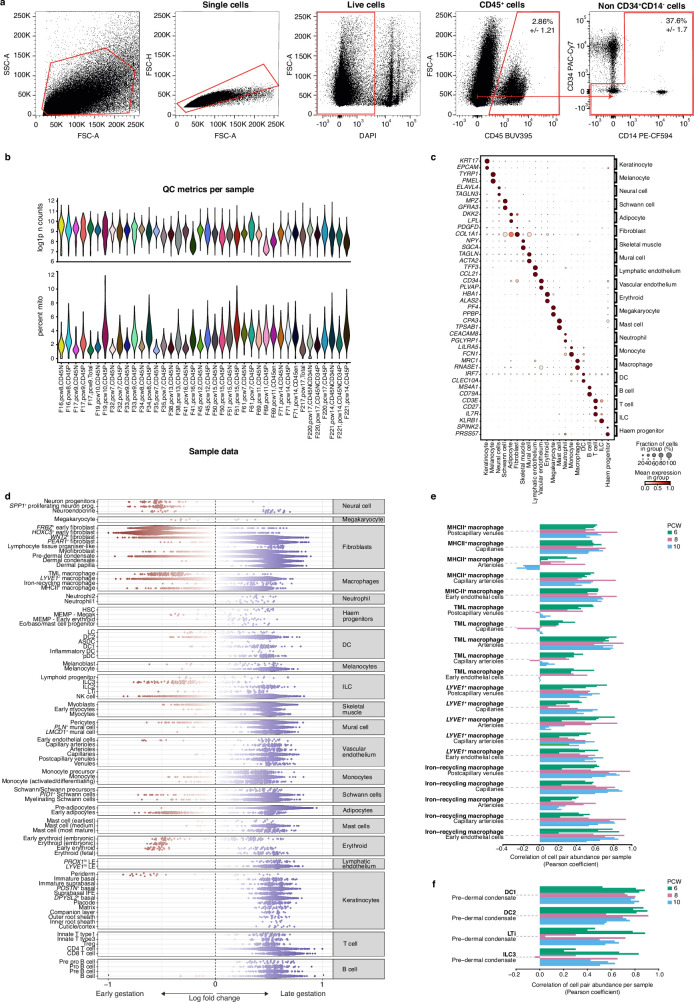
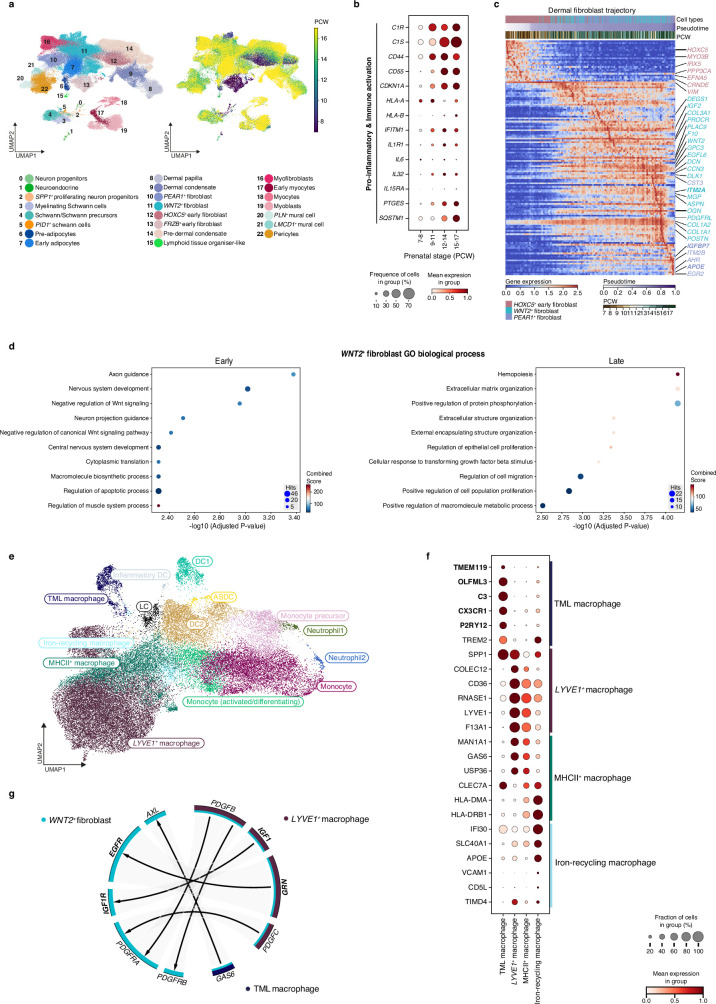
Human prenatal skin is populated by innate immune cells, including macrophages, but whether they act solely in immunity or have additional functions in morphogenesis is unclear. Here we assembled a comprehensive multi-omics reference atlas of prenatal human skin (7-17 post-conception weeks), combining single-cell and spatial transcriptomics data, to characterize the microanatomical tissue niches of the skin. This atlas revealed that crosstalk between non-immune and immune cells underpins the formation of hair follicles, is implicated in scarless wound healing and is crucial for skin angiogenesis. We systematically compared a hair-bearing skin organoid (SkO) model derived from human embryonic stem cells and induced pluripotent stem cells to prenatal and adult skin1. The SkO model closely recapitulated in vivo skin epidermal and dermal cell types during hair follicle development and expression of genes implicated in the pathogenesis of genetic hair and skin disorders. However, the SkO model lacked immune cells and had markedly reduced endothelial cell heterogeneity and quantity. Our in vivo prenatal skin cell atlas indicated that macrophages and macrophage-derived growth factors have a role in driving endothelial development. Indeed, vascular network remodelling was enhanced following transfer of autologous macrophages derived from induced pluripotent stem cells into SkO cultures. Innate immune cells are therefore key players in skin morphogenesis beyond their conventional role in immunity, a function they achieve through crosstalk with non-immune cells.


Conflict of interest statement

Competing interests: J.L. and K.R.K., with the Indiana University Research and Technology Corporation, have a patent relating to the methodology and composition of SkOs (PCT/US2016/058174). K.R.K. is a consultant for StemCell Technologies. All other authors declare no competing interests.

Figures

Fig. 1
Fig. 1. A single-cell atlas of human prenatal skin.
a, Experimental overview demonstrating the generation of scRNA-seq data from dissociated prenatal skin cells (n = 18, 7–17 PCW). Datasets of adult HF, adult healthy skin and hair-bearing SkO were integrated for comparison. Spatial experiments were carried out using RNAscope, immunofluorescence and Visium analyses. Findings of the study were functionally validated using a SkO co-culture. b, Uniform manifold approximation and projection (UMAP) visualization of the prenatal skin dataset with broad annotation of cell states, as denoted by colour and number in the legend. c, Milo beeswarm plot showing the differential abundance of neighbourhoods in prenatal skin across gestation time, annotated by broad cell labels. Red and blue neighbourhoods are significantly enriched in earlier or later gestation, respectively. Colour intensity denotes degree of significance. d, Dotplot showing spatial microenvironments (MEs). Cell type to microenvironment coefficients are normalized by cell type sums, and cell type to microenvironment assignment is shown by colour. ME5, which shows co-locating macrophages and endothelial cells, is highlighted (grey). e, UMAP visualizations of the integrated prenatal skin, adult skin and SkO datasets, coloured by broad cell lineages. ASDC, Axl+Siglec6+ dendritic cells; DC, dendritic cells; HSC, haematopoietic stem cells; LC, Langerhans cells; LE, lymphatic endothelium; LTi, lymphoid tissue inducer cell; MEMP, megakaryocyte-erythroid-mast cell progenitor; NK cell, natural killer cells; pDC, plasmacytoid dendritic cells. The images in a were created using BioRender (https://biorender.com).
Fig. 2
Fig. 2. Human prenatal HF development.
a, Representative images of prenatal skin and HF morphogenesis (stained with haematoxylin and eosin). Scale bars, 200 µm. b, Average proportions of prenatal skin epidermal cell states. c, Large-area (top) and magnified peri-follicular (bottom left) and inter-follicular (bottom right) RNAscope images of prenatal skin (15 PCW) demonstrating the ORS (SLC26A7), matrix (SHH) and the Dp (NDP) with Treg cells (FOXP3) around HFs. Scale bars, 100 µm (top) or 20 µm (bottom). d,e, Inferred pseudotime trajectory of prenatal skin and SkO epidermal cells (d) and fibroblasts (e). UMAP overlaid with partition-based graph abstraction (PAGA) (default threshold), coloured by cell state, showing connectivities (dashed) and transitions (arrows). f, Spatial distribution of WNT2+ fibroblasts and HOXC5+ early fibroblasts. Predicted cell abundances shown as the sum of two-colour gradients per spot (left; scale bars, 100 µm) or averaged across all spots located at the same distance from the tissue border (right; mean (line) ± 2 s.e.m. (shaded area)). Dotted line indicates the tissue border. g, CellPhoneDB-predicted mesenchymal–epithelial interactions (early, immature basal; late, DPYSL2+ basal, POSTN+ basal, placode, matrix, ORS, CL, IRS and cuticle/cortex). The top ten interactions per prenatal skin cell pair are shown (top), and the same interactions are plotted for SkO (bottom). Colour scale represents mean expression values of ligand–receptor pairs. CellPhoneDB-computed significance used empirical shuffling and were adjusted for false discovery rate (FDR). h, RNAscope images showing ACKR3 and CXCL12 expression in early epithelium (SERPINB7+) and pre-Dc cells (PDGFD+) (top) and co-expression at the dermo–epidermal junction (arrows, bottom right). Scale bars, 20 µm. i, Alignment of SkO and prenatal skin pseudotime trajectories considering 15 equispaced pseudotime points. Left, heatmap shows the number of matching TFs (colour scale) for each pair of organoid–prenatal pseudotime points and average alignment path (white line) across all TFs along pseudotime (the diagonal path represents the best-matched pseudotime point–pairs, and vertical and horizontal paths indicate mismatches). Right, average alignment mapping visualized against cell type composition per pseudotime point. For details on statistics and reproducibility, see Methods. Source Data
Fig. 3
Fig. 3. Early dermal fibroblasts and macrophages potentially contribute to scarless skin healing.
a, Dot plot showing variance-scaled, mean expression (dot colour) and per cent of expressing cells (dot size) of DEGs by prenatal (anti-inflammatory and immune suppression) and adult skin fibroblasts (pro-inflammatory and immune activation). b, Matrix plot showing variance-scaled, mean expression (colour) of Milo-generated DEGs (grouped by function) by gestational age (grouped PCW) in WNT2+ fibroblasts. Labels in bold indicate genes selectively referenced in text. c, Bar plot showing cell type co-location, indicated by positive Pearson correlation coefficients calculated between per-spot normalized cell type abundances, for selected cell type pairs (macrophages and WNT2+ fibroblasts). Pearson correlation coefficients were calculated across all skin-covered spots of Visium samples; each sample is shown by an individual bar. d, Spatial distribution of LYVE1+ macrophages and WNT2+ fibroblasts (top two rows) and of TML macrophages and WNT2+ fibroblasts (bottom two rows) (representative 8 PCW samples). Predicted cell abundances shown as the sum of two-colour gradients per spot (left; scale bars, 100 µm) or averaged across all spots located at the same distance from tissue border (right; mean (line) ± 2 s.e.m. (shaded area)). Dotted line indicates tissue border. e, Immunofluorescence (representative 10 PCW prenatal skin cryosections) showing LYVE1+ macrophage (CD45+LYVE1+) co-locating with fibroblasts (VIM+). Scale bars, 50 µm. f, Dot plot showing variance-scaled, mean expression (dot colour) and per cent of expressing cells (dot size) of genes (grouped by function) upregulated by TML macrophages in prenatal and adult skin macrophages. Labels in bold indicate genes selectively referenced in text. g, Bar plot showing cell type co-location, indicated by positive Pearson correlation coefficients calculated between per-spot normalized cell type abundances, for selected cell type pairs (TML macrophage and neural cells). Pearson correlation coefficients were calculated across all skin spots of Visium samples; each sample is shown by an individual bar. For details on statistics and reproducibility, see Methods.
Fig. 4
Fig. 4. Macrophages support prenatal skin angiogenesis.
a, Close proximity of endothelium with macrophages shown in prenatal skin. Left, RNAscope images of cryosections with endothelium (CDH5), TML macrophage (P2RY12) and macrophages (CD68). Scale bars, 100 µm. Centre, immunofluorescence images of cryosections with LYVE1+ macrophages (LYVE1+CD45+) and endothelial cells (CD31+). Scale bars, 10 µm. Right, three-dimensional rendering of co-localized areas (magenta) of endothelial cells (CD31+) and LYVE1+ macrophages (LYVE1+) from whole-mount immunostaining. Scale bars, 80 µm (top) or 5 µm (bottom). b, UMAP visualization of endothelial cell states in prenatal skin and SkO. c, Average proportions of prenatal skin endothelial cell states (bar colours) across gestation. d, Inferred pseudotime trajectory of prenatal skin endothelial cell states differentiating along the arteriolar trajectory and the venular trajectory: UMAP overlaid with PAGA (default threshold), coloured by cell state showing connectivities (dashed) and transitions (arrows). e, Schematic showing differences between prenatal skin and SkOs in pro-angiogenic and anti-angiogenic factors and corresponding receptors. f, Representative whole-mount immunofluorescence images of SkO without (top) and with (bottom) macrophage co-culture at day 47 showing macrophages (CD45), endothelium (CD31) and DAPI nuclei stain (blue). Scale bars, 100 µm. g, Quantification of endothelial cell coverage in SkOs (day 47) cultured with (n = 5, magenta) and without macrophages (n = 5, grey) from 2 batches of differentiation of SkOs and macrophages. Data are mean ± s.d. and statistics generated from unpaired t-test. h, z projection immunofluorescence of cryosections of day 47 SkO co-cultured with macrophages (day 35 of co-culture) demonstrating close interactions of macrophages (CD45, in magenta) and endothelium (CD31, in green). Scale bar, 50 µm. ECs, endothelial cells; LE, lymphatic endothelium. For details on statistics and reproducibility, see Methods. The images in e were created using BioRender (https://biorender.com). Source Data
Extended Data Fig. 1
Extended Data Fig. 1. Temporal and spatial composition of human prenatal skin.
(a) Prenatal skin cells isolation by fluorescence-activated cell sorting into CD45+ and CD45 fractions (n = 18); from the CD45 fraction we further isolated all cells that were not within the CD34+/CD34+CD14 gate (n = 4) to enrich for endothelial cells and keratinocytes. Representative data from n = 1 is shown as mean percentage +/− SD values. (b) Quality control plots showing frequency distribution of UMI counts (log1p-transformed) and percent of UMI counts in mitochondrial genes per sample fraction. (c) Dot plot showing variance-scaled, mean expression (dot colour) and percent of expressing cells (dot size) of defining genes for cell states corresponding to Fig. 1b. (d) Milo beeswarm plot showing differential abundance of neighbourhoods in prenatal skin across gestation time, annotated by refined cell labels. Red/blue neighbourhoods are significantly enriched in earlier/later gestation respectively. Colour intensity denotes degree of significance. (e) Bar plot showing cell type co-location, indicated by positive Pearson correlation coefficients calculated between per-spot normalised cell type abundances, for selected cell type pairs (macrophage and endothelial cells). Pearson correlation coefficients were calculated across all skin-covered spots of Visium samples; each sample is shown by an individual bar. (f) Bar plot showing cell type co-location, indicated by positive Pearson correlation coefficients calculated between per-spot normalised cell type abundances, for selected cell type pairs (pre-dermal condensate and immune cells: DC1, DC2, LTi and ILC3). Pearson correlation coefficients were calculated across all skin-covered spots of Visium samples; each sample is shown by an individual bar. ASDC, Axl+Siglec6+ dendritic cells; CD45en, CD45 negative fraction enriched for keratinocyte/endothelial cells, CD45N, CD45 negative; CD45NCD34N, CD45 negative-CD34 negative; CD45NCD34P, CD45 negative-CD34 positive; CD45P, CD45 positive; DC, dendritic cells; HSC, hematopoietic stem cells; LC, Langerhans cells; LTi, lymphoid tissue inducer cells; MEMP, megakaryocyte-erythroid-mast cell progenitor; pDC, plasmacytoid dendritic cells.
Extended Data Fig. 2
Extended Data Fig. 2. Comparison of the skin organoid with prenatal and adult skin.
(a) UMAP visualisation of the integrated prenatal skin, adult skin and SkO scRNA-seq datasets, coloured by broad cell types for each dataset. (b) UMAP visualisations of integrated data from prenatal skin and SkO, coloured by epidermal (left) and dermal (right) cell types. (c) Heatmap showing conserved cell states (measured by distance in principal component space) between prenatal skin, adult skin and SkO for broad cell categories. (d) Heatmap showing prediction probabilities (overall and per broad cell category) for a logistic regression model trained on time-encoded prenatal skin and adult skin data (y-axis) and projected onto time-encoded SkO data (x-axis). Colour scale indicates median prediction probabilities. DC, dendritic cells.
Extended Data Fig. 3
Extended Data Fig. 3. Prenatal skin epidermal cell composition and comparison with adult hair follicles.
(a) Schematic of stages of HF formation. (b) Dot plot showing variance-scaled, mean expression (dot colour) and percent of expressing cells (dot size) of DEGs between gestational stage groups (grouped PCW) (right) and expression of the same genes by different epithelial cell states in prenatal skin (left). (c) Bar plot showing the average proportions of stromal cell states across gestational age in prenatal skin. Bar colours represent cell states. (d) Heatmap showing the correspondence (measured by Jaccard index) between prenatal skin/SkO (y-axis) and adult (x-axis) epidermal and HF cell states from a logistic regression model trained on adult HF data, projected onto integrated prenatal skin/SkO data. (e) UMAPs showing clustered cell states in integrated data from adult HFs and prenatal/SkO, coloured by prenatal skin/SkO cell types (left) and adult cell types (right). (f) Volcano plot showing differentially expressed genes between prenatal matrix cells and adult matrix cells using Wilcoxon rank-sum, two-sided, Benjamini-Hochberg adjusted. (g) Percentage of FOXP3 coverage in HF regions and non-HF regions across five prenatal skin samples. Data are mean ± SD and statistics (p = 0.0131) generated with an unpaired t-test. (h) Immunostained human prenatal skin at 15PCW for Tregs with FOXP3 (red; red arrows), epithelial keratinocytes with Keratin 14 (yellow) and dermal papilla with SOX2 (cyan; cyan arrows). Scale bar: 100 µm. Tregs, Regulatory T cells. For details on statistics and reproducibility, see Methods. The images in a were created using BioRender (https://biorender.com). Source Data
Extended Data Fig. 4
Extended Data Fig. 4. Differentiation of prenatal hair follicle epithelial cells.
(a) Inferred pseudotime trajectory of prenatal skin and SkO epidermal cell states, differentiating along the ‘ORS/CL’ and ‘IRS’ trajectories, coloured by gestational age (PCW) for prenatal skin (middle) and days of culture for SkO (bottom). UMAP overlaid with cell directionality (arrows) as inferred over the cell-to-cell transition probability matrix from CellRank and coloured by pseudotime (top). (b) Inferred pseudotime trajectory of prenatal skin epidermal cell states differentiating along the ‘ORS/CL’ and ‘IRS’ trajectories, coloured by gene expression (log-transformed). (c) Dot plot showing variance-scaled, mean expression (dot colour) and percent of expressing cells (dot size) in prenatal skin of genes expressed along the ‘ORS/CL’ and ‘IRS’ trajectories. (d) Inferred pseudotime trajectory of prenatal skin and SkO fibroblasts differentiating along the ‘hair’ and ‘dermal’ trajectories, coloured by gestational age (PCW) for prenatal skin (middle) and days of culture for SkO (bottom). UMAP overlaid with cell directionality (arrows) as inferred over the cell-to-cell transition probability matrix from CellRank and coloured by pseudotime (top). (e) Dot plot showing variance-scaled, mean expression (dot colour) and percent of expressing cells (dot size) of FRZB gene in fibroblasts from developing organs. Gestational ages during which individual organs are present are highlighted. (f) Heatmap showing differentially expressed genes across pseudotime along the ‘hair fibroblast trajectory’. Gene associated with genetic hair disorders is highlighted in grey. (g) Violin plot showing expression of CXCL12 in hair mesenchymal cells (violin width proportional to counts). (h) Violin plot showing expression of CXCL12 in hair mesenchymal cells by gestation (PCW) (violin width proportional to counts).
Extended Data Fig. 5
Extended Data Fig. 5. Differentiation of the prenatal hair follicle mesenchyme.
(a) Circos plot showing selected significant (adjusted p-value<0.05, significance calculated in CellphoneDB using empirical shuffling and FDR-adjusted) predicted interactions between pre-dermal condensate and ILC3 and LTi cells in prenatal skin. Arrows represent directionality of interactions (ligand to receptor); connection width is proportional to the CellphoneDB mean value for each ligand-receptor pair. (b) Schematic representation of mesenchymal-epithelial signalling and cellular processes during hair formation. (c) Heatmap showing significant (adjusted p-value <0.05, significance calculated in CellphoneDB using empirical shuffling and FDR-adjusted) predicted interactions between hair mesenchymal cells and epithelial cells (early: Immature basal; late: DPYSL2+ basal, POSTN+ basal, placode, matrix, ORS, CL, IRS, Cuticle/cortex) in SkO. Top 10 interactions per cell pair are shown. Colour scale represents the mean expression values of each ligand-receptor pair in corresponding cell pairs. (d) Heatmap on the left shows interesting trends of distributional distances in the expression of selected differentially expressed TFs across pseudotime between prenatal skin (reference) and SkO. The distributional distance is a Shannon information measure of dissimilarity (unit: nits), and the heatmap visualises these distances across time for each TF after log-transformation and smoothening using a Gaussian kernel (σ = 2) for highlighting their trends. Heatmaps in the middle and right show the interpolated and z-normalised mean expression of those selected TFs across pseudotime in prenatal skin and SkO respectively. (e) Gene expression plots for representative genes in prenatal skin (green) and SkO (blue) across pseudotime. Left column: the interpolated log1p transformed expression (y-axis) against pseudotime (x-axis). The lines represent mean expression trends; the faded data points are 50 random samples from the estimated expression distribution at each time point. Right two columns: actual log1p transformed expression (y-axis) against pseudotime (x-axis) where each point represents a cell. (f) Dot plot showing variance-scaled, mean expression (dot colour) and percent of expressing cells (dot size) of known genes involved in hair formation. (g) UMAP co-embedding of human prenatal (left) and mouse embryonic (E12.5, E13.5 and E14.5) (right) skin coloured by broad cell cluster annotations. (h) Heatmap showing prediction probabilities from a logistic regression model trained on human prenatal skin (x-axis), projected onto mouse embryonic skin (y-axis) for broad cell groupings. Colour scale indicates median prediction probabilities. (i) Heatmap showing prediction probabilities from a logistic model trained on human prenatal skin (x-axis), projected onto mouse embryonic skin (y-axis) for refined cell clusters (only fibroblast sub-populations shown from all cell types). (j) Dot plot showing variance-scaled, mean expression (dot colour) and percent of expressing cells (dot size) of fibroblast marker genes. DC, dendritic cells; Fib, fibroblast; LTi, lymphoid tissue inducer cells; Vessel BECs, Vessel blood endothelial cells; Vessel LECs, Vessel lymphatic endothelial cells. The images in b were created using BioRender (https://biorender.com).
Extended Data Fig. 6
Extended Data Fig. 6. Genetic hair and skin disorders.
(a) Heat map showing differentially expressed genes across pseudotime along the ‘Inner root sheath trajectory’. Genes associated with genetic hair disorders are highlighted in grey. (b) Heat map showing differentially expressed genes across pseudotime along the ‘Outer root sheath/ Companion layer trajectory’. Genes associated with genetic hair disorders are highlighted in grey. (c) Dot plot showing variance-scaled, mean expression (dot colour) and percent of expressing cells (dot size) of genes implicated in genetic hair diseases in prenatal skin and SkO. (d) Dot plot showing variance-scaled mean expression (dot colour) and percent of expressing cells (dot size) of genes causing Epidermolysis Bullosa in prenatal skin and SkO. (e) Indirect immunofluorescence of 15-17 PCW prenatal skin with antibodies against keratin 14, plectin, BP180 (type XVII collagen), laminin-332, type VII collagen, keratin 1. Scale bars = 25 µm. (f) Dot plot showing variance-scaled, mean expression (dot colour) and percent of expressing cells (dot size) of genes causing congenital ichthyoses in prenatal skin and SkO. ARCI, Autosomal Recessive Congenital Ichthyosis; EKV, Erythrokeratodermia Variabilis. For details on statistics and reproducibility, see Methods.
Extended Data Fig. 7
Extended Data Fig. 7. The role of early dermal fibroblasts in prenatal skin.
(a) UMAP visualisation showing stromal cells found in prenatal skin, coloured by cell state (left) and by gestational age (PCW) (right). (b) Dot plot showing variance-scaled, mean expression (dot colour) and percent of expressing cells (dot size) of ‘pro-inflammatory and immune activation’ genes (as shown in Fig. 3a) in prenatal skin fibroblasts by grouped gestational age (PCW). (c) Heat map showing differentially expressed genes across pseudotime along the ‘Dermal fibroblast trajectory’. (d) Gene set enrichment analysis results for differentially expressed genes (wilcoxon, two-sided, Benjamini-Hochberg adjusted) in Milo-defined early- and late-specific neighbourhoods of WNT2+ fibroblasts. Each plot shows the top 10 enriched gene sets (using Gene Ontology Biological Process 2023). The x-axis shows the negative log10 of the adjusted p-value (Fisher’s exact test, Benjamini-Hochberg correction for multiple testing); dot size is proportional to the number of genes associated with the gene set and colour represents the combined Enrichr score calculated within GSEApy. (e) UMAP visualisation of the myeloid cells in prenatal skin data, coloured by cell state. (f) Dot plot showing variance-scaled, mean expression (dot colour) and percent of expressing cells (dot size) of marker genes used to annotate macrophage subsets in prenatal skin. (g) Circos plot visualisation of representative significant (adjusted p-value <0.05, significance calculated in CellphoneDB using empirical shuffling and FDR-adjusted) predicted interactions between macrophages (LYVE1+ and TML macrophage) and co-localising WNT2+ fibroblasts in prenatal skin. Arrows represent directionality of interactions (ligand to receptor); connection width is proportional to the CellphoneDB mean value for each ligand-receptor pair. ASDC, Axl+Siglec6+ dendritic cells; DC, dendritic cells; LC, Langerhans cells. Source Data
Extended Data Fig. 8
Extended Data Fig. 8. The role of macrophages in prenatal skin neurovascular development.
(a) UMAP showing clustered cell states in integrated data from embryonic immune cells and prenatal skin myeloid cell subset. (b) Heatmap showing the correspondence (measured by Jaccard index) between embryonic immune cells (x-axis) and prenatal skin (y-axis) myeloid cell states for a logistic regression model trained on embryonic data and projected onto prenatal skin myeloid cell subset. TML macrophage had the highest proportion prediction to Mac4 (embryonic brain microglia). (c) Gene set enrichment analysis results of over-expressed genes (wilcoxon, two-sided, Benjamini-Hochberg adjusted) in macrophage subsets (TML, Iron-recycling, LYVE1+ and MHCII+, macrophages). Each plot shows the top 10 enriched gene sets (using Gene Ontology Biological Process 2023 (left) and MSigDB Hallmark 2020 (right) databases). The x-axis shows the negative log10 of the adjusted p-value (Fisher’s exact test, Benjamini-Hochberg correction for multiple testing); dot size is proportional to the number of genes associated with the gene set and colour represents the combined Enrichr score calculated within GSEApy. (d) Heatmap showing prediction probabilities from a logistic regression model trained on classes of reindeer fibroblasts (pro-regenerative, pro-inflammatory and mixed populations) (x-axis), projected onto prenatal skin fibroblasts grouped by age (y-axis). Colour scale indicates median prediction probabilities. (e) Dot plot showing the variance-scaled, mean expression (dot colour) and percent of expressing cells (dot size) of selected pro-regenerative and pro-fibrotic genes in prenatal skin fibroblasts by gestational age (grouped PCW). (f) Heatmap showing prediction probabilities from a logistic regression model trained on reindeer macrophage clusters (x-axis), projected onto prenatal skin macrophage subsets (y-axis). Colour scale indicates median prediction probabilities. (g) Percentage scratch width closure (y-axis) quantified over time (x-axis) for fibroblasts cultured with macrophages (green) or in isolation (black) in n = 3 independent experiments. Data represented as percentage values ±SD. Statistics were generated with two-way ANOVA with Tukey’s multiple comparisons test (p-values shown at 6hrs: 0.0480, 12hrs: 0.0035, 18hrs: 0.0001, 24hrs: 0.0042, 66hrs: 0.0118, 72hrs: <0.0001). (h) Circos plot visualisation of selected significant (adjusted p-value <0.05, significance calculated in CellphoneDB using empirical shuffling and FDR-adjusted) predicted interactions between TML macrophages and co-localising neural cells in prenatal skin. Arrows represent directionality of interactions (ligand to receptor); connections are coloured by sender cell type with width proportional to the CellphoneDB mean value for each ligand-receptor pair. (i) Heatmap of normalised (z-score) mean expression of angiogenesis gene modules in prenatal skin macrophages. CD7hiP: CD7high progenitors; CD7loP: CD7low progenitors; ErP, erythroid progenitors; GMP, granulocyte-monocyte progenitors; HSPC, haematopoietic stem and progenitor cells; LC, Langerhans cells; Mac1-4, macrophages 1-4; MkP, megakaryocte progenitors; YSMP, yolk-sac derived myeloid-biased progenitors. For details on statistics and reproducibility, see Methods. Source Data
Extended Data Fig. 9
Extended Data Fig. 9. Endothelial cell heterogeneity and interactions with macrophages.
(a) Dot plot visualisation of selected significant (adjusted p-value<0.05, significance calculated in CellphoneDB using empirical shuffling and FDR-adjusted) CellphoneDB-predicted interactions between macrophage subsets and co-localising vascular endothelial cells in prenatal skin, grouped by function. Right: Ligand (first gene in each gene pair) is expressed by macrophages; Left: Ligand (first gene in each gene pair) is expressed by endothelial cells. Dot colour represents the mean expression values of each ligand-receptor pair for the corresponding cell pairs, dot size represents -log10(adjusted p-value). (b) Violin plots of gene module scores in prenatal skin and SkO endothelial cells. Scores were derived from marker genes for the different endothelial cell groups. LE, lymphatic endothelium.
Extended Data Fig. 10
Extended Data Fig. 10. Factors driving angiogenesis and endothelial cell differentiation.
(a) Inferred pseudotime trajectory of prenatal skin endothelial cell states coloured by gestational age (PCW). UMAP overlaid with cell directionality (arrows) as inferred over the cell-to-cell transition probability matrix from CellRank (left) and coloured by pseudotime (right). (b) Heat map showing differentially expressed genes across pseudotime along the ‘arteriolar’ differentiation trajectory. (c) Heat map showing differentially expressed genes across pseudotime along the ‘venular’ differentiation trajectory. (d) Heatmap showing the correspondence (measured by Jaccard index) between prenatal skin (x-axis) and blood vessel organoid cell states (y-axis) for a logistic regression model trained on prenatal skin data. The top 10 predicted prenatal cell states were retained for visualisation. (e) Dot plot showing variance-scaled, mean expression (dot colour) and percent of expressing cells (dot size) of blood flow-related genes in prenatal skin and SkO capillary arteriole cells. (f) Heatmap of normalised (z-score) mean expression of hypoxia gene module in prenatal skin and corresponding cell categories in SkO. (g) Violin plots of ‘Tip’ and ‘Stalk’ cell module scores in prenatal skin and SkO endothelial cells. (h) UMAP visualisation of the ‘Tip’ cell module score in prenatal skin (arterioles, capillaries, capillary arterioles, PROX1hi LE, early endothelial cells, LYVE1hi LE, postcapillary venules, venules) and SkO endothelial cells (capillary arterioles). LE, lymphatic endothelium; MEMP, megakaryocyte-erythroid-mast cell progenitor. Source Data
Extended Data Fig. 11
Extended Data Fig. 11. Macrophages support prenatal skin and skin organoid angiogenesis.
(a) Dot plot showing variance-scaled, mean expression (dot colour) and percent of expressing cells (dot size) of pro- and anti-angiogenic factors and of corresponding receptors in prenatal skin and SkO endothelial cells. Genes encoding the main pro-angiogenic factors secreted by macrophages in prenatal skin are highlighted. (b) Dot plot showing variance-scaled, mean expression (dot colour) and percent of expressing cells (dot size) of vascular endothelial growth factors in prenatal skin and SkOs. (c) Dot plot showing variance-scaled, mean expression (dot colour) and percent of expressing cells (dot size) of genes (vascular endothelial growth factor receptors and endothelial differentiation) in prenatal skin and SkO capillary arteriole cells. (d) Comparison of regulon activity between prenatal skin (x-axis) and SkO (y-axis) capillary arterioles. (e) Gene regulation network for regulons with high specificity score in prenatal skin and/or SkO capillary arterioles. Arrows indicate the direction of regulation from transcription factor to target gene. Edges show the proportion of genes shared by two regulons (colour for proportion in the larger regulon and thickness for proportion in the smaller regulon). (f) Gene network for four regulons with high specificity score in prenatal skin and/or SkO capillary arterioles (GATA2, GATA1, NFATC1, SOX7), and selected GATA2 target genes. The proportion of red in the ring around nodes indicates the proportion of gene ontology terms associated with angiogenesis in the gene set enrichment analysis performed with genes in the network. (g) Tree diagram showing network of interactions (NicheNet) linking the ligand VEGFA (red) to GATA2 as target gene (blue) through identified signalling mediators and transcriptional regulators (grey). Edges representing signalling interactions are coloured red and gene regulatory interactions in blue; edge thickness is proportional to the weight of the represented interaction. (h) Gating strategy used on iPSC-derived macrophages before co-culture (n = 3 batches) to isolate single live cells, analyse expression of macrophage markers (CD45, CD14, CD16, CD206) and exclude dendritic cells (CD1c). (i) Representative images of angiogenesis assay of endothelial cells without (top) and with macrophages (bottom), red arrows indicate disorganised network. Quantification of endothelial density in 2D cultures of iPSC-derived endothelial cells without (n = 6, grey) and with macrophages (n = 6; magenta) at 24, 48 and 72 h of culture from 2 independent differentiation batches. Data are mean ± SD and statistics generated with an unpaired t-test. For details on statistics and reproducibility, see Methods Source Data

Comment in

References

    1. Lee, J. et al. Hair-bearing human skin generated entirely from pluripotent stem cells. Nature582, 399–404 (2020). - PMC - PubMed
    1. Sadler, T. W. & Langman, J. Langman’s Medical Embryology (Lippincott Raven, 2000).
    1. Muller, M., Jasmin, J. R., Monteil, R. A. & Loubiere, R. Embryology of the hair follicle. Early Hum. Dev.26, 159–166 (1991). - PubMed
    1. Kennedy, K. M. et al. Questioning the fetal microbiome illustrates pitfalls of low-biomass microbial studies. Nature613, 639–649 (2023). - PMC - PubMed
    1. Suo, C. et al. Mapping the developing human immune system across organs. Science376, eabo0510 (2022). - PMC - PubMed

MeSH terms