. 2024 Nov;635(8038):406-414.
doi: 10.1038/s41586-024-08038-z. Epub 2024 Oct 16.

Dopamine dynamics are dispensable for movement but promote reward responses

Affiliations

Dopamine dynamics are dispensable for movement but promote reward responses

Xintong Cai et al. Nature. 2024 Nov.

Abstract

Dopamine signalling modes differ in kinetics and spatial patterns of receptor activation1,2. How these modes contribute to motor function, motivation and learning has long been debated3-21. Here we show that action-potential-induced dopamine release is dispensable for movement initiation but supports reward-oriented behaviour. We generated mice with dopamine-neuron-specific knockout of the release site organizer protein RIM to disrupt action-potential-induced dopamine release. In these mice, rapid in vivo dopamine dynamics were strongly impaired, but baseline dopamine persisted and fully supported spontaneous movement. Conversely, reserpine-mediated dopamine depletion or blockade of dopamine receptors disrupted movement initiation. The dopamine precursor L-DOPA reversed reserpine-induced bradykinesia without restoring fast dopamine dynamics, a result that substantiated the conclusion that these dynamics are dispensable for movement initiation. In contrast to spontaneous movement, reward-oriented behaviour was impaired in dopamine-neuron-specific RIM knockout mice. In conditioned place preference and two-odour discrimination tasks, the mice effectively learned to distinguish the cues, which indicates that reward-based learning persists after RIM ablation. However, the performance vigour was reduced. During probabilistic cue-reward association, dopamine dynamics and conditioned responses assessed through anticipatory licking were disrupted. These results demonstrate that action-potential-induced dopamine release is dispensable for motor function and subsecond precision of movement initiation but promotes motivation and performance during reward-guided behaviours.


Conflict of interest statement

Competing interests Y.L. is listed as an inventor on a patent application (PCT/CN2018/107533) describing GRAB probes. T.P. is listed as an inventor on a patent application (PCT/US2017/062993) describing the RdLight1 probe. The other authors declare no competing interests.

Figures

Extended data figure 1.
Extended data figure 1.. Slice amperometry in dorsal striatum and additional movement analyses of RIM cKODA mice.
a. Schematic of slice amperometry in subareas of the dorsal striatum. b, c. Example traces (b) and quantification (c) of peak amplitudes of dopamine release evoked by electrical stimulation before and after 1 μM tetrodotoxin (TTX), 16 slices from 4 mice. d-e. Example traces (d) and quantification (e) of peak amplitudes as in b+c, RIM control 9 slices from 4 mice, RIM cKODA 10/4. f-i. As d+e, but in the other subareas shown in a, RIM control 10/4, RIM cKODA 10/4. j-t. Quantification of parameters of gait, RIM control 1122 cycles from 10 mice, RIM cKODA 1206/10. u-z. Schematics (u, w, y) and analyses (v, x, z) of horizontal bar, vertical bar and Rotarod (after four days of training) tests, RIM control 7 mice, RIM cKODA 7. aa-ab. Representative trajectories (aa) and quantification of distance traveled in 30 min (ab) before (day 1) and after i.p. injection of PBS (day 2) and DMSO (day 4), RIM control 4, RIM cKODA 3. ac, ad. Schematic (ac) of unilateral 6-OHDA lesions followed by analyses of rotations before and after i.p. injection of the D1 and D2 receptor agonist apomorphine in 6-OHDA pre-treated mice (1 mg/kg) and quantification of net contralateral rotations (ad), RIM control 6, RIM cKODA 6. ae, af. Schematic of videography (ae) and analyses of distance traveled in 30 min (af) for the mice in Fig. 1p–t, RIM control 13, RIM cKODA 14. Some of the data are from the baseline condition shown in Fig. 1m and these data points are replotted here. Data are mean ± SEM; *** p < 0.001, assessed by: two-sided Mann-Whitney rank-sum tests for c, e, g, i, j-r, v, x, af; two-way ANOVA for z, ad; and Kruskal-Wallis analysis of variance with post-hoc Dunn’s tests for ab. For videos of gait, see Supplementary video 1.
Extended data figure 2.
Extended data figure 2.. Pharmacological inhibition of locomotion by drug infusion and assessment of excitation power output.
a. Schematic of assessment of movement with bilateral drug infusion in dorsal striatum. b, c. Representative trajectories (b) and quantification of total distance traveled in 15 min (c) before and after local infusion of ACSF or D1 (SCH23390, 20 μM, 1 μl for each site) and D2 (haloperidol, 40 μM, 1 μl for each site) receptor antagonists, 4 mice. d, e. Example traces (d) and quantification (e) of fluorescence variation quantified as standard deviation (SD) of ΔF/F0 of GRABDA fluorescence at variable output power in freely moving mice, 7 mice. f, g. As in d+e, but for tdTomato, 7 mice; d-g reveal that ΔF/F0 variation is similar across excitation output powers. h. Schematic of the measurement of dopamine dynamics in freely moving mice. Fiber photometry and drug delivery were in the right dorsal striatum with an optofluid cannula. i-l. Example traces (i+j) and quantification of the variation of ΔF/F0 of GRABDA (k) and of tdTomato (l) fluorescence before and after local infusion of the sodium channel blocker TTX (500 nM, 1 μl), 6 mice. Data are mean ± SEM; * p < 0.05, ** p < 0.01, assessed by two-sided Mann-Whitney rank-sum tests for c, k; Kruskal-Wallis analysis of variance with post-hoc Dunn’s tests were used for e, g.
Extended data figure 3.
Extended data figure 3.. Haloperidol injection and additional analyses of GRABDA dynamics in RIM cKODA mice.
a-c. Example traces (a) and quantification of the variation of ΔF/F0 of GRABDA (b) and of tdTomato (c) fluorescence before and after i.p. injection of the D2 receptor antagonist haloperidol (2 mg/kg), RIM control 5 mice, RIM cKODA 5. d. Average GRABDA and tdTomato signals registered to the artificially shifted instantaneous velocity plotted in polar coordinates for the experiment shown in Fig. 2g+h. The shifting of the velocity time course to earlier or later time points relative to the photometry illustrates that the GRABDA fluorescence signal peaks after the velocity and suggests that dopamine signaling tracks the velocity time course, RIM control 5, RIM cKODA 5. e. Analyses of distance traveled for the experiment shown in Fig. 2, n as in a–c. f. Quantification of tdTomato fluorescence during contralateral movement initiations shown in Fig. 2i+j, event heatmaps are sorted by the order of the corresponding velocity signals in Fig. 2i, RIM control 354 events from 5 mice, RIM cKODA 455/5. g-i. Quantification of time courses of velocity amplitudes (g), and of GRABDA (h) and tdTomato (i) fluorescence changes during ipsilateral movement initiations (right turns, velocity angles between 180° and 360°). Event heatmaps were sorted by the peak velocity amplitude in g, RIM control 405/5, RIM cKODA 469/5. Data are mean ± SEM; ** p < 0.01, assessed by two-sided Mann-Whitney rank-sum tests for b, e.
Extended data figure 4.
Extended data figure 4.. In vivo GCaMP6s fluctuations in RIM cKODA mice.
a. Strategy for dual-color fiber photometry of dopamine axonal GCaMP6s and tdTomato. b, c. Example traces (b) and quantification (c) of fluorescence variation as SD of ΔF/F0 of GCaMP6s and of tdTomato in freely moving mice, RIM control 6 mice, RIM cKODA 6. d-f. Example traces (d) and quantification of fluorescence variation as SD of ΔF/F0 of GCaMP6s (e) and of tdTomato (f) before and after i.p. injection of the D1 and D2 receptor agonist apomorphine (1 mg/kg). The suppression of GCaMP6s fluorescence changes by apomorphine indicates that GCaMP6s fluorescence changes reflect activity-dependent depolarizations of dopamine axons that are inhibited by D2 auto-receptors, n as in b+c. g-i. Time course of fluorescence in individual trials (event heatmaps, top) and average data (bottom) for GCaMP6s (g) and tdTomato (h) fluorescence aligned to the sensory stimulation (dashed line), and peak GCaMP6s per mouse (i). Event heatmaps in g+h were sorted by the peak amplitude in g, RIM control 93 events from 6 mice, RIM cKODA 93/6. The finding that axonal Ca2+ dynamics are not detectably changed in RIM cKODA mice is unexpected given RIMs role in targeting CaV2 channels to presynaptic active zones. It could be due to distinct RIM functions in dopamine neuron axons,, due to a distinct set of Ca2+ channels in dopamine axons,, due to compensatory effects in RIM cKODA mice because of loss of the D2 auto-receptor feedback, due to technical differences in experiments, or due to Ca2+ entry away from active zones and not under the control of RIM, which might be enhanced if CaV2 channels are mislocalized. Data are mean ± SEM; ** p < 0.01, assessed by two-sided Mann-Whitney rank-sum tests for c, e, i.
Extended data figure 5.
Extended data figure 5.. Assessment of dopamine axon GCaMP6s and striatal RdLight1 dynamics in RIM cKODA mice.
a. Schematic for assessment of fluorescence of GCaMP6s expressed in striatal dopamine axons and RdLight1 expressed in striatal neurons. b, c. Example traces (b) and cross-correlation (c) of GCaMP6s and RdLight1 signals, RIM control 4 mice, RIM cKODA 4. d, e. Individual (event heatmaps, top) and average (bottom) time courses of GCaMP6s (d) and RdLight1 (e) fluorescence aligned to the light flash (dashed line). Event heatmaps in d+e were sorted by the peak amplitude in d, RIM control 204 events from 4 mice, RIM cKODA 202/4. f. Correlation analyses of transients in d+e (area under the curve, 0 to 600 ms after stimulation), RIM control 203/4, RIM cKODA 198/4. g-i. Individual (event heatmaps, top) and average (bottom) time courses of velocity amplitudes (g), and of GCaMP6s (h) and RdLight1 (i) fluorescence during contralateral movement initiations. Event heatmaps in g were sorted by the peak velocity amplitude, and h+i by the peak amplitude of GCaMP6s in h, RIM control 563/4, RIM cKODA 599/4. j-n. Analyses of peaks from d, e, and g-i for each mouse, n as in b+c. There was a strong positive correlation in RIM control mice between GCaMP6s and RdLight1 fluctuations that was disrupted in RIM cKODA mice (c). Field illuminations induced dopamine axonal GCaMP6s transients in both genotypes, but failed to trigger dopamine release in RIM cKODA mice (d-f). Axonal Ca2+ dynamics and striatal dopamine fluctuations correlated during contralateral turns in RIM control mice. In RIM cKODA mice, only Ca2+ transients, not movement-associated dopamine transients, were detected (g-i). Together with Extended data fig. 4, the data suggest that dopamine neuron firing and the underlying regulatory network are not strongly disrupted in RIM cKODA mice. Data are mean ± SEM; * p < 0.05, *** p < 0.001, assessed by: two-sided Mann-Whitney rank-sum tests for areas under the curve in c, j-n.
Extended data figure 6.
Extended data figure 6.. Ablating the Ca2+ sensor Syt-1 in dopamine neurons does not disrupt in vivo dopamine dynamics or locomotor behaviors.
a-c. Analyses of motor behaviors as in Extended data fig. 1u–z, but for Syt-1 control and Syt-1 cKODA mice. For dopamine release analyses in Syt-1 cKODA, see. The time spent to cross a horizontal bar (a), to climb down a vertical bar (b), or the latency to fall from a Rotarod after four days of training (c) are quantified, Syt-1 control 10 mice, Syt-1 cKODA 10. d-i. In vivo fiber photometry performed as in Fig. 2 and Extended data fig. 3, but for Syt-1 cKODA mice with example traces (d) and quantification of variation of ΔF/F0 of GRABDA (e) and of tdTomato (f) fluorescence before and after i.p. injection of the D2 receptor antagonist haloperidol (2 mg/kg), and with individual (event heatmaps, top) and average (bottom) time courses of GRABDA (g) and tdTomato (h) fluorescence aligned to the sensory stimulation (dashed line) and peak GRABDA per mouse (i). Event heatmaps are sorted by the peak GRABDA amplitude in g; Syt-1 control 200 events from 4 mice, Syt-1 cKODA 200/4. Altogether, knockout of Syt-1 from dopamine neurons did not disrupt motor function. Despite the strong impairment in dopamine release in brain slices,, in vivo dopamine fluctuations were maintained, likely due to the remaining release after Syt-1 knockout, presumably asynchronous release, that is detected with in vivo microdialysis or in brain slices after dopamine transporter (DAT) blockade (striatum), or in response to stimulus trains (somatodendritic release). Hence, removing the fast Ca2+ sensor from dopamine neurons does not suffice to abolish in vivo dopamine dynamics and Syt-1 cKODA mice cannot be used to test behavioral roles of these dynamics. Data are mean ± SEM; * p < 0.05, assessed by: two-sided Mann-Whitney rank-sum test for a, b, e, i; two-way ANOVA for c.
Extended data figure 7.
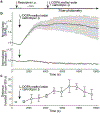
Extended data figure 7.. Analyses of GRABDA F0 and locomotion after L-DOPA treatment in reserpine-depleted mice.
a. Schematic of the experiment. b, c. Assessment of GRABDA F0 (b) and quantification of distance traveled (c, analyzed in 900 s bins for the first 900 s and from 950–9950 s) before and after i.p. injection of L-DOPA (250 mg/kg L-dopa methyl ester with 25 mg/kg carbidopa) in mice treated with reserpine (3 mg/kg reserpine) ~18 h before L-DOPA injection, GRABDA F0 is normalized to the first 5 min, 3 mice. Data are mean ± SEM.
Extended data figure 8.
Extended data figure 8.. Additional analyses L-DOPA treated mice.
a. Schematic of the experiment. b-d. Example traces (b) and quantification of the variation of ΔF/F0 of GRABDA (c) and of tdTomato (d) fluorescence before and after i.p. injection of L-DOPA (250 mg/kg L-dopa methyl ester with 25 mg/kg carbidopa), 5 mice. e-g. Individual (event heatmaps, top) and average (bottom) time courses of GRABDA (e) and tdTomato (f) fluorescence aligned to the sensory stimulation (dashed line), and peak GRABDA (g) for each mouse, before and after i.p. injection of L-DOPA. Data in a-g establish that GRABDA fluorescence increases can be detected when L-DOPA is present without reserpine depletion, indicating that GRABDA fluorescence is not saturated after L-DOPA injection. Event heatmaps in e+f were sorted by the peak GRABDA amplitude in e, baseline 136 events from 5 mice, L-DOPA 118/5. h-j. Individual (event heatmaps, top) and average (bottom) time courses of GRABDA (h) and tdTomato (i) fluorescence aligned to the sensory stimulation (dashed line), and peak GRABDA (j) for each mouse, before and after i.p. injection of reserpine (3 mg/kg) and L-DOPA (250 mg/kg L-dopa methyl ester with 25 mg/kg carbidopa). Data were recorded during the experiment that is shown in Fig. 3b–j. Event heatmaps in h+i were sorted by the GRABDA peak amplitude in h, baseline 393/4, reserpine + L-DOPA 223/4. Data are mean ± SEM; * p < 0.05, assessed by two-sided Mann-Whitney rank-sum tests in c, g, j.
Extended data figure 9.
Extended data figure 9.. Additional analyses of GRABDA fluorescence during movement initiation in reserpine and L-DOPA treated mice.
a. Average GRABDA and tdTomato signals registered to the artificially shifted instantaneous velocity plotted in polar coordinates before and after i.p. injection of reserpine (3 mg/kg) and L-DOPA (250 mg/kg L-dopa methyl ester with 25 mg/kg carbidopa) for the experiment shown in Fig. 3b–j, 4 mice. b. Quantification of tdTomato fluorescence during contralateral movement initiations shown in Fig. 3g+h, event heatmaps are sorted by the order of the corresponding velocity signals in Fig. 3g, baseline 316 events from 4 mice, reserpine + L-DOPA 378/4. c-e. Individual (event heatmaps, top) and average (bottom) time courses of velocity amplitudes (c) and GRABDA (d) and tdTomato (e) fluorescence changes during ipsilateral movement initiations (right turns, velocity angles between 180° and 360°) for the experiment shown in Fig. 3b–j. Event heatmaps in c-e were sorted by the peak velocity amplitude in c, baseline 317/4, reserpine + L-DOPA 557/4. f-j. Individual (event heatmaps, top) and average (bottom) time courses of velocity amplitudes (f), and of GRABDA (g) and tdTomato (h) fluorescence during contralateral movement initiations (left turns, velocity angles between 0° and 180°), and peak velocity (i) and GRABDA (j) per mouse, for the experiment shown in Fig. 3k–n, RIM control data is replotted from Fig. 2j+l. Event heatmaps in f-h were sorted by the peak velocity amplitude in f, baseline 385/4, reserpine + L-DOPA 362/4. The observations that L-DOPA restored movement in RIM cKODA mice to pre-reserpine levels (f, Fig. 3k–n), and that dopamine denervation followed by apomorphine-induction of rotations was unaffected (Extended data figs. 1ac+ad), indicate that there is no strong sensitization of dopamine receptors or dopamine-modulated circuits after RIM ablation. Data are mean ± SEM; * p < 0.05, assessed by two-sided Mann-Whitney rank-sum tests in i, j.
Extended data figure 10.
Extended data figure 10.. GRABDA analyses in ventral striatum and additional analyses during the probabilistic cue-reward association task in RIM cKODA mice.
a. Schematic of slice imaging. b-d. Representative images (b) and quantification (c+d) of dopamine release monitored by GRABDA fluorescence in slices containing the ventral striatum (dashed lines outline the striatum), evoked by a single stimulus (b+c) or 10 stimuli (d, 10 Hz), RIM control 10 slices from 4 mice, RIM cKODA 10/4. e, f. Example traces (e) and quantification (f) of ventral striatum fluorescence variation quantified as standard deviation (SD) of GRABDA and of tdTomato raw fluorescence on day 1 of the task in Fig. 5, RIM control 6 mice, RIM cKODA 7. g, h. As in e and f, but for dorsal striatum on day 2, n as in e+f. The in vivo deficits are overall similar in dorsal and ventral striatum. There might be an enhanced GRABDA signal in ventral striatal brain slices compared to dorsal striatum (Fig. 1a–d) in RIM cKODA mice. This was not observed with amperometry, and could be because of differences in the roles of RIM, or technical differences in experiments, or because of detection of other transmitters by GRABDA, for example norepinephrine for which innervation is prominent in ventral but not dorsal striatum,,. i. The number of habituation days for the experiment shown in Fig. 5. RIM control 6, RIM cKODA 7. j. Number of trials that the mice completed during each training phase. For analyses, only completed blocks were used, n as in i. k, l. Anticipatory licks (k) and peak licks to expected reward during the 1 s time window from water onset (l) for each odor during training days 1 to 7, n as in i. m. Average ventral striatum GRABDA odor responses (within 3 s from odor onset), n as in i. n-q. Average ventral striatum GRABDA reward responses (n, p, within 201 to 1200 ms from water onset) and reward omission responses (o, q, within 1501 to 2500 ms from water onset) for odors 1 (n+o) and 2 (p+q), n as in i. r, s. Total licks (r, within 1 to 3000 ms after water onset) and average GRABDA fluorescence (s, within 201 to 1200 ms after water onset) for free water, n as in i. Data are mean ± SEM; ** p < 0.01, *** p < 0.001, assessed by two-sided Mann-Whitney rank-sum tests in c, d, f, h, i, j.
Figure 1.
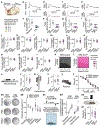
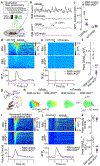
Figure 1.. Normal motor function after disrupting evoked dopamine release.
a. Schematic of imaging in parasagittal slices of RIM cKODA and RIM control mice. b-d. Representative images (b) and quantification (c+d) of dopamine release monitored by GRABDA fluorescence (dashed lines outline the striatum), evoked by paired (b+c, 1 Hz) or 10 stimuli (d, 10 Hz), RIM control 8 slices from 3 mice, RIM cKODA 11/3. e. Schematic of gait analyses. f-h. Average speed (f) and cadence (g) across gait cycles, and scatter plot and linear regression thereof (h), RIM control R = 0.88 in 1122 cycles from 10 mice, RIM cKODA 0.85 in 1206/10. i, j. As f-h, but for stride length against speed, RIM control R = 0.42 in 1122/10, RIM cKODA 0.57 in 1206/10. k. Schematic of movement initiation analyses in a round arena. l, m. Representative trajectories (l) and quantification of distance traveled in 30 min (m) before and after i.p. injection of reserpine (2 mg/kg), RIM control 7 mice, RIM cKODA 8. n, o. As l+m, but for D1 (SCH23390, 1 mg/kg) and D2 (haloperidol, 2 mg/kg) receptor antagonists, RIM control 6, RIM cKODA 6. p-r. Individual (p) and average time courses of movement initiations (q), and peak speed per mouse (r). Event heatmaps (p) were sorted by the peak speed amplitude, RIM control 3615 events from 13 mice, RIM cKODA 4352/14. s, t. Frequency of peak speeds (s) and durations (t) of detected movement events above the indicated cutoffs, n as in p-r. Data are mean ± SEM; ** p < 0.01, *** p < 0.001 as assessed by: two-sided Mann-Whitney rank-sum tests in c, d, f, g, i, m, o, q, r; two-way ANOVA for s, t. For dopamine amperometry, and additional analyses of motor function, see Extended data fig. 1. Exact p-values for this and all following figures are in the Supplementary table 1.
Figure 2.
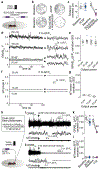
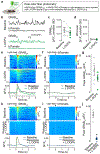
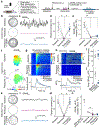
Figure 2.. Disrupted in vivo dopamine dynamics but unaltered movement initiation in RIM cKODA mice.
a. Schematic of the experiment. The fiber photometric canula was in the right dorsal striatum. b, c. Example traces (b) and quantification (c) of fluorescence variation quantified as standard deviation (SD) of ΔF/F0 of GRABDA and tdTomato fluorescence, RIM control 5 mice, RIM cKODA 5. d-f. Time course of fluorescence in individual trials (event heatmaps, top) and average data (bottom) for GRABDA (d) and tdTomato (e) fluorescence aligned to the sensory stimulation (dashed line), and peak GRABDA per mouse (f). Event heatmaps in d+e were sorted by the peak amplitude in d, RIM control 117 events from 5 mice, RIM cKODA 115/5. g. Schematic of movement initiation analyses as established before. h. Average GRABDA and tdTomato signals registered to their concurrent velocity; each velocity vector was plotted in polar coordinates, and the corresponding fluorescence changes (ΔF/F0) were mapped onto these velocity vectors for each genotype and fluorophore. i-l. Individual (event heatmaps, top) and average (bottom) time courses of velocity amplitudes (i) and GRABDA fluorescence changes (j) during contralateral movement initiations (left turns, velocity angles between 0° and 180°), and peak velocity (k) and GRABDA (l) per mouse. Event heatmaps in i+j were sorted by the peak velocity amplitude, RIM control 354/5 mice, RIM cKODA 455/5. Data are mean ± SEM; ** p < 0.01, assessed by two-sided Mann-Whitney rank-sum test in c, f, k, l. For assessment of locomotion after dopamine receptor blockade, ΔF/F0 variation as a function of excitation power output, ΔF/F0 variation after sodium channel blockade, ΔF/F0 variation before and after GRABDA blockade, additional movement-related GRABDA fluorescence of RIM cKODA mice, dopamine axon Ca2+ dynamics with GCaMP6s of RIM cKODA mice, and dopamine release with RdLight1, see Extended data figs. 2–5.
Figure 3.
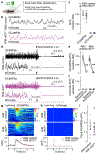
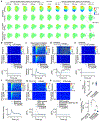
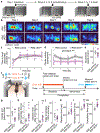
Figure 3.. L-DOPA restores movement but not dopamine dynamics.
a. Schematic of the experiment and of the time-course of drug treatment, i.p. dosage: reserpine 3 mg/kg, L-DOPA methyl ester 250 mg/kg, carbidopa 25 mg/kg. b-e. Representative traces of trajectories (b) and GRABDA signals (c), and quantification of distance traveled over 30 min (d) and GRABDA variation (e) in mice in an open field, 4 mice. f-j. Average GRABDA signals registered to concurrent velocity in polar coordinates (f), individual (event heatmaps, top) and average (bottom) time course of velocity amplitudes (g) and GRABDA fluorescence changes (h) during contralateral movement initiations (left turns, velocity angles between 0° and 180°), and peak velocity (i) and GRABDA (j) per mouse. Event heatmaps in g+h were sorted by the peak velocity amplitude, baseline 316 events from 4 mice, reserpine + L-DOPA 378/4. k-n. As b-e, but for RIM cKODA mice; in n, the RIM control condition is replotted from Fig. 2c for comparison, RIM cKODA 4 mice. Data are mean ± SEM; * p < 0.05, ** p < 0.01, assessed by: Kruskal-Wallis analysis of variance with post hoc Dunn’s tests for d, e, m, n (vs. reserpine); two-sided Mann-Whitney rank-sum tests for i, j. For assessment of Syt-1 cKODA mice, F0 and movement after reserpine + L-DOPA, additional GRABDA fluorescence in control and reserpinized mice, and additional GRABDA fluorescence in RIM cKODA mice, see Extended data figs. 6–9.
Figure 4.
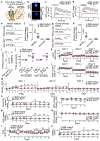
Figure 4.. RIM cKODA mice learn to make binary choices but the vigor of reward-oriented behavior is reduced.
a. Schematic of food-conditioned place preference (food-CPP) in which the less preferred side at baseline (day 1) is associated with food on days 2, 4, 6 and 8. On days 3, 5, 7 and 9, place preference is assessed. b-e. Representative example heatmaps of mouse location in the CPP arena (b) and quantification of percentage of time spent on test days in the food-associated chamber (c), of frequency of entries into the center of the CPP apparatus (d), and of movement speed of during these center entries (e). In the heatmaps (b), the time spent of each mouse is normalized in each session, RIM control 6 mice, RIM cKODA 6. f. Schematic and time course of the perceptual decision-making task in which the correct choice after exposure to odor A or B is rewarded by a water drop. The data were collected while mice learned to discriminate two odors. g-j. Quantification of the number of center port pokes (g), trial initiation times (h+i) and the number of trials it took to achieve > 90% accuracy for two consecutive sessions (j) over all trials, RIM control 9, RIM cKODA 9. k-m. Quantification of the reaction time (k), movement time (l) and trial completion time (m) in the first two sessions; times were calculated as the median of all trials for each mouse, n as in g-j. Data are mean ± SEM; * p < 0.05, ** p < 0.01, assessed by: two-way ANOVA for c, d; two-sided Mann-Whitney rank-sum tests for e, g-m.
Figure 5.
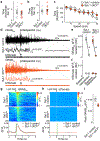
Figure 5.. Disrupted anticipatory behavior of RIM cKODA mice in a probabilistic cue-reward association task.
a. Schematic of the task in head-fixed mice. b-e. Quantification of free water trials with the time course of GRABDA fluorescence (b, top) and licking (b, bottom) aligned to free water delivery (dashed line) on days 1 and 17 of the training (b), and peak GRBADA (c), peak licks (d) and mean delayed licks (e), RIM control 6 mice, RIM cKODA 7. f, g. Quantification of odor trials with anticipatory licks during the 2 s time window between odor and water delivery (f) and peak licks to reward within the first second of water delivery (g) for odors 1 (80% reward), 2 (40% reward) and 3 (no reward) from day 8 to day 20, n as in b-e. h, i. Quantification of odor trials with time course of GRABDA fluorescence (h, heatmaps), average GRABDA fluorescence (i, top) and licking (i, bottom) aligned to odor and water delivery per mouse. Heatmaps in h are sorted by the peak amplitude in odor 1 for each genotype, n as in b-e. j-l. Average GRABDA for each odor (j, within 3 s from odor onset), and average GRABDA for reward trials (k, within 201 to 1200 ms from water onset) and omission trials (l, within 1501 to 2500 ms from water onset), n as in b-e. Data are mean ± SEM; * p < 0.05, ** p < 0.01, *** p < 0.001 assessed by: two-sided Mann-Whitney rank-sum tests for c, d, e, j-l; two-way ANOVA for f, g. For additional assessment of licking and of GRABDA fluorescence in slices and in vivo, see Extended data fig. 10; for analyses of licking and dopamine dynamics on each training day, see Supplementary figures 1 to 4.

References

    1. Liu C, Goel P & Kaeser PS Spatial and temporal scales of dopamine transmission. Nat Rev Neurosci 22, 345–358 (2021). - PMC - PubMed
    1. Grace AA Dysregulation of the dopamine system in the pathophysiology of schizophrenia and depression. Nat Rev Neurosci 17, 524–32 (2016). - PMC - PubMed
    1. da Silva JA, Tecuapetla F, Paixao V & Costa RM Dopamine neuron activity before action initiation gates and invigorates future movements. Nature 554, 244–248 (2018). - PubMed
    1. Howe MW & Dombeck DA Rapid signalling in distinct dopaminergic axons during locomotion and reward. Nature 535, 505–510 (2016). - PMC - PubMed
    1. Dodson PD et al. Representation of spontaneous movement by dopaminergic neurons is cell-type selective and disrupted in parkinsonism. Proceedings of the National Academy of Sciences 113, E2180–E2188 (2016). - PMC - PubMed

References for Methods and Extended data

    1. Kaeser PS et al. RIM1alpha and RIM1beta are synthesized from distinct promoters of the RIM1 gene to mediate differential but overlapping synaptic functions. J Neurosci 28, 13435–13447 (2008). - PMC - PubMed
    1. Kaeser PS et al. RIM proteins tether Ca2+ channels to presynaptic active zones via a direct PDZ-domain interaction. Cell 144, 282–95 (2011). - PMC - PubMed
    1. Zhou Q et al. Architecture of the synaptotagmin–SNARE machinery for neuronal exocytosis. Nature 525, 62–67 (2015). - PMC - PubMed
    1. Backman CM et al. Characterization of a mouse strain expressing Cre recombinase from the 3’ untranslated region of the dopamine transporter locus. Genesis 44, 383–390 (2006). - PubMed
    1. Allen Institute for Brain Science (2004). Allen Mouse Brain Atlas [mouse, P56, coronal]. atlas.brain-map.org (2011).

MeSH terms

LinkOut - more resources