. 2024 Nov;635(8040):1001-1009.
doi: 10.1038/s41586-024-08061-0. Epub 2024 Oct 16.

Spatial proteomics identifies JAKi as treatment for a lethal skin disease

Affiliations

Spatial proteomics identifies JAKi as treatment for a lethal skin disease

Thierry M Nordmann et al. Nature. 2024 Nov.

Abstract

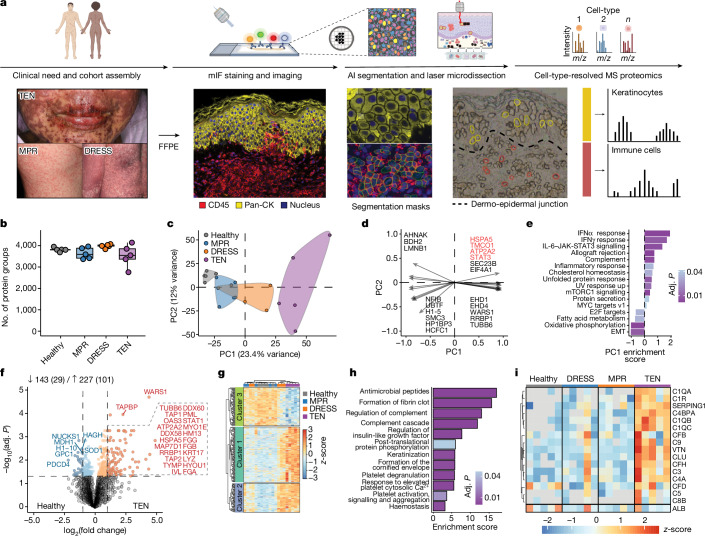
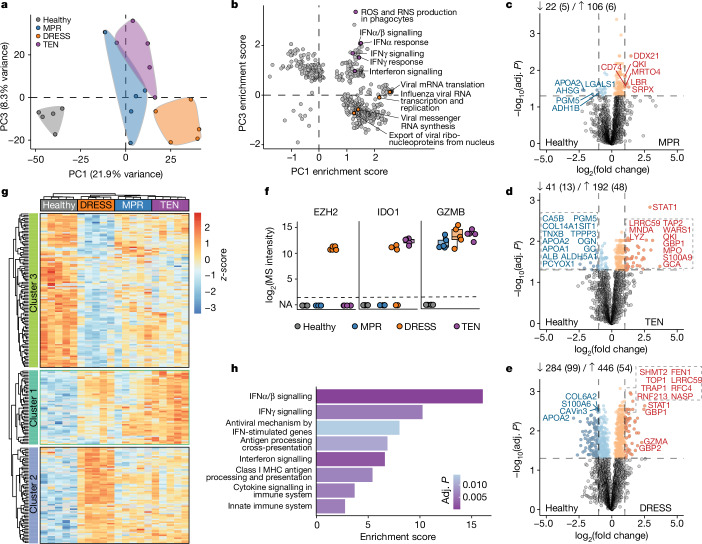
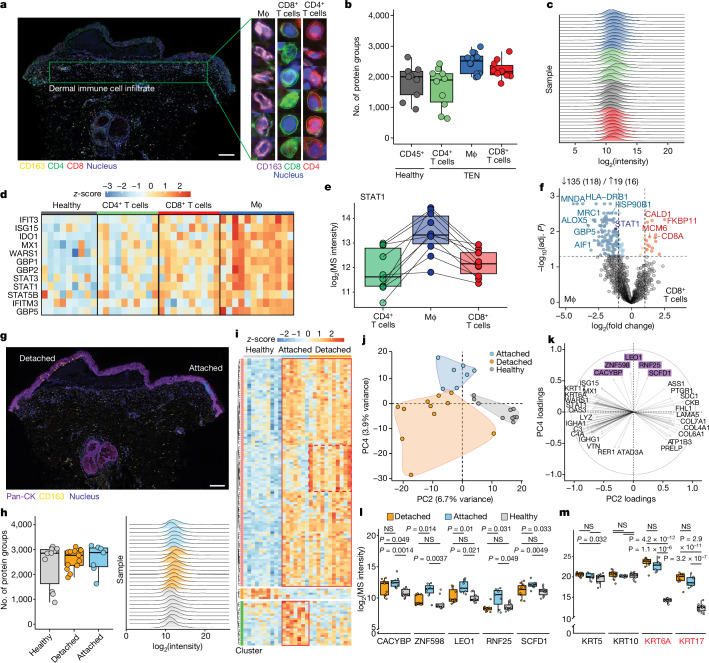
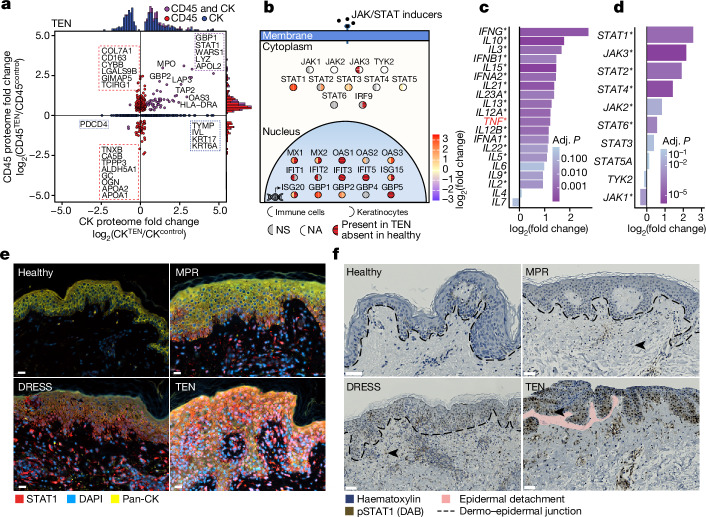
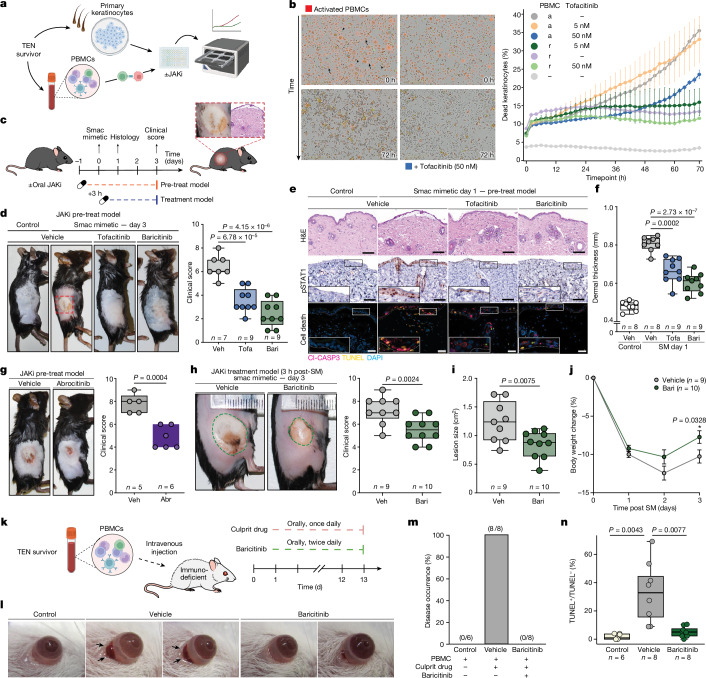
Toxic epidermal necrolysis (TEN) is a fatal drug-induced skin reaction triggered by common medications and is an emerging public health issue1-3. Patients with TEN undergo severe and sudden epidermal detachment caused by keratinocyte cell death. Although molecular mechanisms that drive keratinocyte cell death have been proposed, the main drivers remain unknown, and there is no effective therapy for TEN4-6. Here, to systematically map molecular changes that are associated with TEN and identify potential druggable targets, we utilized deep visual proteomics, which provides single-cell-based, cell-type-resolution proteomics7,8. We analysed formalin-fixed, paraffin-embedded archived skin tissue biopsies of three types of cutaneous drug reactions with varying severity and quantified more than 5,000 proteins in keratinocytes and skin-infiltrating immune cells. This revealed a marked enrichment of type I and type II interferon signatures in the immune cell and keratinocyte compartment of patients with TEN, as well as phosphorylated STAT1 activation. Targeted inhibition with the pan-JAK inhibitor tofacitinib in vitro reduced keratinocyte-directed cytotoxicity. In vivo oral administration of tofacitinib, baricitinib or the JAK1-specific inhibitors abrocitinib or upadacitinib ameliorated clinical and histological disease severity in two distinct mouse models of TEN. Crucially, treatment with JAK inhibitors (JAKi) was safe and associated with rapid cutaneous re-epithelialization and recovery in seven patients with TEN. This study uncovers the JAK/STAT and interferon signalling pathways as key pathogenic drivers of TEN and demonstrates the potential of targeted JAKi as a curative therapy.


Conflict of interest statement

Competing interests: A patent for treatment of TEN, SJS–TEN and SJS with JAKi has been filed (US patent: provisional application no. 63/531,677; European patent: provisional application no. 23 190 686.8, with T.M.N., L.E.F. and M.M. as inventors). The patent application belongs to the Max-Planck-Gesellschaft zur Förderung der Wissenschaften e.V. M.M. is an indirect investor in Evosep Biosystems. The authors declare no other competing interests.

Figures

Fig. 1
Fig. 1. DVP workflow and cell-type-specific proteome of keratinocytes in cutaneous drug reactions.
a, Top, schematic of the DVP workflow for cell-type-resolved proteomics in CADRs (n = 21; 5 each for DRESS, MPR and healthy, and 6 for TEN). Bottom, representative images of each step, including excised keratinocytes (outlined in yellow in the image on the far right) and immune cells (outlined in red in the far right image) from FFPE tissue sections. Partially created with Biorender.com. AI, artificial intelligence. mIF, multicolour immunofluorescence; MS, mass spectrometry; pan-CK, pan-cytokeratin. b, Number of proteins identified in keratinocytes across cohorts. n = 5 individuals per cohort. ce, Principal components analysis (c), main drivers (loadings) of PC1–PC2 separation (d) and gene set enrichment analysis (e) (GSEA) (MSigDB Hallmark) of PC1. Adj. P, adjusted P value; EMT, epithelial–mesenchymal transition. f, Differential expression of proteins in TEN and healthy keratinocytes. Coloured dots indicate significant DEPs, the dashed vertical line indicates log2-transformed fold change of ±1. Numbers indicate the total number of DEPs in each direction. n = 5 individuals per cohort. g, Hierarchical clustering of significant proteins by ANOVA. Colour indicates normalized intensity (z-score). n = 5 individuals per cohort. h, Overrepresentation analysis (Reactome) of ANOVA cluster 1, ordered by enrichment score. Colour indicates degree of significance. i, Semi-supervised heat map of complement factors (and albumin to exclude blood contamination) in the indicated conditions. Colour indicates normalized values (z-score). n = 5 individuals per cohort. f, Unpaired two-sided t-test. g, One-way ANOVA with post hoc Tukey’s Honest significant difference (HSD). eh, Benjamini–Hochberg correction for multiple comparisons (false discovery rate (FDR) < 0.05). In box plots the centre is the media, box edges delineate the 25th to 75th centiles and whiskers extend to furthest points within 1.5× the interquartile range.
Fig. 2
Fig. 2. Cell-type-specific proteome of lesional immune cells.
a, Principal component analysis. n = 5 individuals per cohort. b, Scatter plot of gene set enrichment scores (MsigDB Hallmark, Gene Ontology Biological Processes) present in both PC1 and PC3. Terms that include ‘viral’ or ‘interferon’ are highlighted. RNS, reactive nitrogen species; ROS, reactive oxygen species. ce, DEPs between healthy and MPR (c), TEN (d) or DRESS (e) immune cells. Coloured dots indicate significant DEPs, dashed vertical lines indicate log2-transformed fold change of ±1. Numbers indicate the total number of DEPs in each direction. n = 5 individuals per cohort. f, Selected proteins with distinct intensities across cohorts. g, Hierarchical clustering of significant proteins by ANOVA. Colour indicates normalized intensities (z-score). n = 5 individuals per cohort. h, Overrepresentation analysis (Reactome) of ANOVA cluster 1, ordered by enrichment score. MHC, major histocompatibility complex. Colour indicates degree of significance. ce, Unpaired two-sided t-test. g, One-way ANOVA with post hoc Tukey’s HSD. be,g,h, Benjamini–Hochberg correction for multiple comparisons (FDR < 0.05).
Fig. 3
Fig. 3. Spatial proteomic profiling of immune cell subtypes in TEN.
a, Left, immunofluorescence image of TEN with segmented CD163+ macrophages, CD4+ and CD8+ T cells. Right, representative single-cell images and segmentation contours. Mϕ, macrophage. Scale bar, 200 μm. b,c, Number of identified proteins (b) and their intensity (c) across all samples, colour-coded by cell type. d, Heat map of interferon pathway proteins across samples grouped by cell type. Colour indicates normalized intensities (z-score). e, STAT1 intensity values across immune cell subtypes. Lines connect measurements from the same patient. f, DEPs between indicated cell types. Coloured dots represent significant DEPs, dashed lines indicate log2-transformed fold change of ±1. Numbers indicate the total number of DEPs in each direction. g, Immunofluorescence of a TEN sample with segmented keratinocytes from detached (orange; blister roof) and attached (blue; adjacent to blister) regions. Scale bar, 200 μm. h, Number of proteins identified in keratinocytes (left) and intensity distribution (right) across samples. i, Semi-supervised hierarchical clustering of significant proteins by ANOVA with fold change greater than 1. Colour indicates normalized intensities (z-score). Borders of visually distinct subclusters are outlined in red. j,k, Principal component analysis (j) and main drivers of PC2 and PC4 (k). l,m, Proteins of interest that vary between detached versus attached cells (l; highlighted in k) and across cohorts (m). Alarmins are labelled in red. bd, n = 12 macrophage, 10 CD4+ cell, 10 CD8+ cell and 9 healthy samples from n = 12 disease-affected and 7 healthy individuals. e,f, paired samples for each cell type in n = 10 individuals. hm, n = 7 attached, 11 detached and 9 healthy samples from n = 11 disease-affected and 7 healthy individuals. a,g, Immunofluorescence staining was performed on all samples, representative images are shown. f, Paired two-sided t-test. i, One-way ANOVA with post hoc Tukey’s HSD. f,i, Benjamini–Hochberg correction for multiple comparisons (FDR < 0.05). NS, not significant.
Fig. 4
Fig. 4. The JAK/STAT pathway is potently activated in TEN.
a, DEPs in keratinocytes (CK) and immune (CD45) cells in patients with TEN compared with healthy participants. Each dot represents a protein and colour indicates cell type. Histograms above and to the right display the distribution of fold changes for the indicated cell type. n = 5 individuals per cohort and cell type. b, JAK/STAT pathway proteins in immune cells (left semicircle) and keratinocytes (right semicircle). Colour represents fold change in TEN compared with healthy donors; red with horizontal black lines indicates proteins identified in TEN only. n = 5 individuals per cohort and cell type. NA, data not available. c,d, Differentially expressed mRNA transcripts in TEN compared with healthy tissue for selected cytokines (c) and components of the JAK/STAT pathway (d). Asterisks indicate significant differences between groups. n = 10 individuals per cohort. TNF is highlighted. e,f, Representative images of STAT1 and pan-cytokeratin (e) and phosphorylated STAT1 (pSTAT1) (f) staining in tissue sections across cohorts. n = 5 individuals per cohort, representative images shown. Scale bars: 20 μm (e), 50 μm (f). ad, Unpaired two-sided t-test. a,c,d, Benjamini–Hochberg correction for multiple comparisons (FDR < 0.05).
Fig. 5
Fig. 5. JAK/STAT inhibition reduces severity of TEN in vitro and in vivo.
a,b, Schematic of live-cell imaging assay (a) with representative images of labelled keratinocytes (arrows) and unlabelled PBMCs (arrowhead) in co-culture for the indicated duration, with or without 50 nM tofacitinib to measure cytotoxicity over time (b). r, resting; a, activated. n = 6 biological replicates per condition, 4 field of views per well. Data are mean ± s.e.m. c, Schematic of oral JAKi treatment in the smac-mimetic-induced model of TEN. Oral JAKi (tofacitinib (tofa), 30 mg kg−1; baricitinib (bari), 10 mg kg−1; abrocitinib (abr), 20 mg kg−1) was started one day before (‘pre-treat model’) or 3 h after (‘treatment model’) subcutaneous injection of smac mimetic. Outcome assessment was performed on day 1 (histology) and day 3 (clinical score). dj, Clinical assessment (d,g,h), histology (e), dermal thickness (f; 15 measurements per mouse), lesion size (i) and change in body weight (j) in the pre-treat (dg) and treatment models (hj). e, Insets show magnification of indicated area. Scale bars, 100 μM. Number of mice per cohort as indicated; each data point represents 1 mouse; 2 independent experiments; representative images are shown. j, Weight change data are mean ± s.e.m. Cl-CASP3, cleaved caspase-3; H&E, haematoxylin and eosin; SM, smac mimetic; veh, vehicle. k, Schematic of oral JAKi treatment in the humanized mouse model of TEN. ln, Ocular reaction (l, black arrows), disease occurrence (m) and percentage of subepithelial cell death (n) in the corresponding cohort following daily culprit-drug administration with or without oral baricitinib (10 mg kg−1). Number of mice as indicated. d,fj, One-tailed unpaired Welch’s t-test. n, Unpaired two-sided t-test. a,c,k, Partially created with Biorender.com.
Fig. 6
Fig. 6. Beneficial effect of JAK/STAT inhibition in patients with TEN.
Disease course in a patient with TEN (SCORTEN 4) associated with cancer treatment. Disease progression was observed during high-dose intravenous methylprednisolone treatment and the patient developed persistent hyperglycaemia. JAK1i rescue therapy with abrocitinib was initiated on day 4, resulting in visible cessation of progression within 48 h and initial re-epithelialization within 4 days. Top, photographs of the back of the patient, showing the degree of re-epithelialization at the indicated timepoints after hospital admission. Bottom, Treatment schedule. Arrow marks start of abrocitinib treatment.
Extended Data Fig. 1
Extended Data Fig. 1. Deep Visual Proteomics workflow.
a, Side-by-side H&E and multicolor immunofluorescence (mIF) of 3 μm FFPE tissue sections across all cohorts, representative images shown. Scale bar, 200 µm. b, Machine learning based image segmentation was followed by random-forest based classification to ensure no overlapping contours (‘negative selection’) were microdissected, yielding pure and cell-type specific contours (‘positive selection’). c,d, Identification of unique protein groups (c) and principal component analysis (d) across all patients in the indicated cell type. Each dot represents a patient, color represents the cell type. e,f, Pearson correlation (e) and differentially expressed proteins (DEP, f) quantified across all patients in the indicated cell type. Colored dots are significant DEPs, dashed vertical line indicate log2 fold change of ≤ 1 or ≥ 1. Unpaired two-sided t-test with Benjamini-Hochberg correction for multiple comparisons (FDR < 0.05). a-f, n = 21 individuals (5 each DRESS/MPR/Healthy, 6 for TEN). TEN, Toxic Epidermal Necrolysis; MPR, Maculopapular Rash; DRESS, Drug Reaction with Eosinophilia and Systemic Symptoms.
Extended Data Fig. 2
Extended Data Fig. 2. Keratinocyte and immune cell proteome.
a-c, Rank plot of median protein intensity (a), data completeness per protein (b) and coefficient of variation (CV) per cohort (c) of the keratinocyte proteome. Keratins are highlighted in green (a). d, Number of differentially expressed proteins (DEP) in keratinocytes of MPR/DRESS/TEN compared to healthy. e, DEPs in keratinocytes of DRESS versus healthy. Colored dots are significant DEPs, dashed vertical line indicate log2 fold change of ≤ 1 or ≥ 1. Numbers indicate DEPs in each direction. f, g, Overrepresentation analysis (reactome) of ANOVA cluster 2 and 3 (shown in Fig. 1g), ordered by enrichment score. Color indicates degree of significance. h, Semisupervised heatmap of complement factors in immune cells of the indicated conditions. Color indicates normalized intensity levels (z score). i, Number of proteins identified in immune cells across cohorts. j-l, Rank plot of median protein intensity (j), data completeness per protein (k) and coefficient of variation (CV) per cohort (l) of the immune cell proteome. Ptprc is highlighted in green (j). m-o, Principal component analysis (m), top 20 proteins (loadings) contributing to PC1/ 3 (n) and PC1 gene set enrichment analysis (MSigDB Hallmark) of immune cells, ordered according to enrichment score (o). p, DEPs in the indicated conditions compared to healthy. Shaded area within columns indicates the proportion of non-overlapping differentially regulated proteins. q, Upset plot of uniquely identified proteins specific to each of the indicated conditions. r, Source Data from Kim, D., Kobayashi, T., Voisin, B. et al. Targeted therapy guided by single-cell transcriptomic analysis in drug-induced hypersensitivity syndrome: a case report. Nat Med 26, 236–243 (2020). Scatter plot of EZH2 and previously identified markers (STAT1, JAK3, IL2RG) in DRESS showing fold change (x-axis) and the ratio of cell expression in diseased versus healthy samples (y-axis) in PBMC lymphocyte clusters of DRESS. s, Representative histology stained for EZH2, CD45 and pan-Cytokeratin in DRESS (n = 5) and healthy (n = 5) skin tissue sections. Representative images shown. t,u, Overrepresentation analysis (“Reactome”) of ANOVA cluster 2 (shown in Fig. 2g), ordered by enrichment score (t) and semisupervised heatmap of enriched proteins of “activation of ATR in response to replication stress” (u). Color indicates degree of statistical significance (t) and normalized intensities (u). d,e,p unpaired two-sided t-test. d-g,p,t, Benjamini-Hochberg correction for multiple comparisons (FDR < 0.05). a-q,t-u, n = 5 individuals per cohort (MPR, DRESS, TEN, healthy). Box plots: median (center), interquartile range (box, 25th-75th percentiles), whiskers (furthest points within 1.5 * interquartile range). TEN, Toxic Epidermal Necrolysis; MPR, Maculopapular Rash; DRESS, Drug Reaction with Eosinophilia and Systemic Symptoms.
Extended Data Fig. 3
A, Top 15 proteins that significantly follow a linear relationship from healthy to attached to detached keratinocytes. The proteins are displayed in order of highest MS intensity values in detached keratinocytes (top panel) and healthy keratinocytes (bottom panel). Colors denote sample origin. Box plots: median (center), interquartile range (box, 25th-75th percentiles), whiskers (furthest points within 1.5 * interquartile range). b, Circos plots to visualize ligand-receptor interactions between keratinocytes (CK) and immune cells (CD45) across the cutaneous drug reactions (MPR, DRESS, TEN), normalized to healthy. In the bottom panels (CK > CD45) immune cells are the recipient, while in the top panels (CD45 > CK) keratinocytes are the recipient. Arrows indicate interaction direction, colors the different functional categories as indicated, and width of arrow the difference in average expression levels. c, Differentially expressed proteins in keratinocytes (x-axis) and immune cells (y-axis) of DRESS (left) or MPR (right) compared to healthy. Each dot represents a protein, color indicates cell type. n = 5 individuals per cohort and cell type. Histograms above and to the right display the distribution of fold changes along the respective cell type. d. Nuclear Stat1 intensity per cell (shown in Fig. 4e), normalized to its nuclear stain intensity. Each dot represents a single cell measurement. n = 5000 cells per individual, n = 5 individuals each for TEN, DRESS, Healthy, 4 for MPR. Box plots: median (center), interquartile range (box, 25th-75th percentiles). Unpaired two-sided t-test on mean normalized Stat1 values. TEN, Toxic Epidermal Necrolysis; MPR, Maculopapular Rash; DRESS, Drug Reaction with Eosinophilia and Systemic Symptoms.
Extended Data Fig. 4
Extended Data Fig. 4. WARS1 expression in cutaneous drug reactions.
a. Protein expression level of WARS1 across all cohorts and cell types as indicated. b, Identified amino acid sequence and sequence coverage of WARS1 using mass-spectrometry across all samples. c, Histology of WARS1 across cohorts as indicated. Scale bar = 50 µm. d,e, Differential expression analysis of proteins depicted in Fig. 5b for immune cells (c) and keratinocytes (d). Two-sided t-test. Valid values per protein and cohort as depicted. Box plots: median (center), interquartile range (box, 25th-75th percentiles), whiskers (furthest points within 1.5 * interquartile range). TEN, Toxic Epidermal Necrolysis; MPR, Maculopapular Rash; DRESS, Drug Reaction with Eosinophilia and Systemic Symptoms.
Extended Data Fig. 5
Extended Data Fig. 5. Targeted transcriptomics of bulk tissue sections.
a, Schematic representation of the targeted transcriptomic analysis performed on bulk FFPE scrolls using the nCounter Inflammation panel. Number of measured transcripts as indicated (n = 624). b-c, Venn diagram of identified transcripts detected by targeted transcriptomics of bulk tissue (top) and proteins identified using DVP (bottom) of keratinocytes (b) or immune cells (c). Correlation analysis metrics for overlapping proteins / transcripts as indicated. d, Hierarchical clustering of ANOVA significant proteins. Color indicates normalized intensities (z score). e,f, Principal Component analysis (PCA) of transcriptome from bulk tissue sections across all cohorts as indicated. g, Differentially expressed transcripts between healthy and DRESS (left), TEN (middle) or MPR (right). Colored dots are significant transcripts, and the top ten in each direction are shown. h,i, Upset plot of differentially regulated transcripts across all conditions compared to healthy (h). Those uniquely regulated in TEN are color-marked in the original volcano plot (right), followed by overrepresentation analysis (GOBP, i). a-i, n = 44 individuals (10 each for Healthy, TEN and 12 for DRESS and MPR). d, One-way ANOVA with post-hoc Tukey HSD. g,h, unpaired two-sided t-test. d, g-i, Benjamini-Hochberg correction for multiple comparisons (FDR < 0.05). TEN, Toxic Epidermal Necrolysis; MPR, Maculopapular Rash; DRESS, Drug Reaction with Eosinophilia and Systemic Symptoms.
Extended Data Fig. 6
Extended Data Fig. 6. Phosphoproteomic analysis of TEN.
a, Number of Class I phosphosites (localization probability > 75%; otherwise, non-class I) identified in TEN and Healthy per sample and overall. b, Principal Component Analysis (PCA). c, Differentially regulated phosphosites between TEN and healthy. Colored dots are significant, dashed vertical line indicate log2 fold change of ≤ 1 or ≥ 1. d-e, Gene-centric enrichment analysis shown as dotplot (MSigDB, d) or chord diagram of top five terms and related proteins (GOBP, e) of upregulated phosphosites in TEN. Size of dots correlate to the number of mapped proteins per term and color represents degree of statistical significance (d). f, Site-specific enrichment analysis (ssGEA2, PTMSigDB) of upregulated phosphosites in TEN. Points are color-coded according to the origin of the signature set (kinase-substrate interaction = green, perturbation = blue, molecular signaling pathway = purple). g, Number of identified STAT1/4/5 phosphosites in healthy and control samples, with numerical annotations indicating the identified phosphosites per group. c-f, Benjamini-Hochberg correction for multiple comparisons (FDR < 0.05). a-g, n = 8 (healthy) and 13 (TEN). TEN, Toxic Epidermal Necrolysis.
Extended Data Fig. 7
Extended Data Fig. 7. JAK inhibition in smac-mimetic mouse model of TEN.
a, Schematic experimental protocol for assessing JAK inhibitor efficacy in the smac-mimetic (SM) induced TEN model. Evaluation on day 1 (D1, histology) and day 3 (D3, clinical score). JAK inhibitors (10 mg/kg Baricitinib, 30 mg/kg Tofacitinib, 20 mg/kg Abrocitinib or 10 mg/kg upadacitinib) or vehicle (20% Captisol, 50 μl) were given orally twice daily. Partially created with Biorender.com. b, Individual and combined clinical scores for the three assessment criteria (Epidermal disruption, Rubor, Oedema) evaluating clinical severity on D1 and D3 after SM-injection. c. Representative histology (H&E, pSTAT1, Ki67 and CD45) of the corresponding cohorts without SM (UT, untreated) and on D1 and D3 post-SM. Insets magnify indicated area of interest. Scale bars = 100 µM. d, Dermal thickness of the control cohorts, without SM. Each data point represents 1 mouse, n = 15 measurements/mouse. e, Immunofluorescence staining for cell death in the indicated cohorts following SM injection. Dotted lines indicate the dermo-epidermal junction. b-e, n = 7 (Vehicle D3), 8 (Vehicle D1) or 9 (tofacitinib and baricitinib) mice examined over 4 independent experiments (2 each D1 & D3 cohorts). f,g, Percentage weight change over three days post SM injection in the corresponding treatment groups. h, Representative macroscopic image, clinical assessment score and relative weight change following SM injection and pretreatment with upadacitinib (n = 7) or vehicle (n = 4). Weight change data points (f, g, h) show mean +/− SEM. h, one-tailed Welch t-test. All box plots: median (center), interquartile range (box, 25th-75th percentiles), whiskers (furthest points within 1.5 * interquartile range); Veh, vehicle; Tofa = tofacitinitb; Bari = baricitinib; Abr = abrocitinib.
Extended Data Fig. 8
Extended Data Fig. 8. JAK inhibition in humanized mouse model of TEN.
a, Schematic of oral JAK inhibitor treatment in the humanized mouse model of TEN. Partially created with Biorender.com. b, Ocular reaction following daily culprit drug administration ± oral baricitinib (10 mg/kg) with a plus or minus under each picture depending on the occurrence of an immune-reaction. c, Representative H&E and TUNEL immunohistochemistry images of the murine eye (scale bars = 500μm) across the cohorts. Insets magnify the conjunctival subepithelial area of interest (scale bars = 50 μm). Arrows indicate epithelial cell death (TUNEL +). d, Quantification of TUNEL positive, TUNEL negative, their ratio and total count of subepithelial cells of the corresponding cohort. Each data point is a mouse. Box plots: median (center), interquartile range (box, 25th-75th percentiles), whiskers (furthest points within 1.5 * interquartile range). Unpaired, two-sided t-test. b-d, n = 6 control, 8 vehicle and 8 baricitinib treated mice.
Extended Data Fig. 9
Extended Data Fig. 9. JAK inhibition in 4 patients with TEN and SJS/TEN.
a, 45-year-old male as described in Fig. 6. b, 67-year-old male with hepatocellular carcinoma under checkpoint inhibitor (Tislelizumab) therapy with clinically and histologically confirmed toxic epidermal necrolysis (TBSA 35%, SCORTEN 3, predicted mortality 35.3%). Methylprednisolone (1 mg/kg/day) and tofacitinib (10 mg/day for six days, 5 mg/day for six days) was given. Rapid cessation of disease progression was observed followed by 20% re-epithelialization of detached skin areas six days later. c, 72-year-old female with clinically and histologically confirmed Stevens-Johnson-Syndrome / TEN overlap syndrome (TBSA 10%, SCORTEN 2, predicted mortality 12.1%) associated with allopurinol intake. Upon admission she was immediately treated with methylprednisolone (1 mg/kg/day) and abrocitinib (200 mg/day for seven days, 100 mg/day for seven days) resulting in cessation of progression with regression of erythema within three days and 25% re-epithelialization of detached skin areas within seven days. d, 18-year-old male with clinically and histologically confirmed Stevens-Johnson-Syndrome/TEN overlap syndrome (TBSA 12%, SCORTEN 1, predicted mortality 3.2%) associated with allopurinol intake. Upon admission, the patient was treated with methylprednisolone (1 mg/kg/day) and abrocitinib (200 mg/day for seven days, 100 mg/day for seven days), resulting in cessation of progression with regression of erythema within three days and 30% re-epithelialization of detached skin areas by day seven. All H&E stained FFPE lesional skin biopsies were taken on day 0 (timepoint of hospital admission). e, pSTAT1 staining before and after JAK-inhibitor treatment, per patient. TBSA, total body surface area. Scale bars as indicated [μm].
Extended Data Fig. 10
Extended Data Fig. 10. JAK inhibition in 3 patients with TEN and SJS/TEN.
a, 67-year-old female with clinically and histologically confirmed toxic epidermal necrolysis (TBSA 35%, SCORTEN 2, predicted mortality 12.1%) associated with metronidazole intake, unresponsive to methylprednisolone (1 mg/kg/day) monotherapy was given tofacitinib (10 mg/day for seven days, 5 mg/day for seven days). Rapid cessation of disease progression was observed followed by 30% re-epithelialization of detached skin areas seven days later. b, 45-year-old male with clinically and histologically confirmed Stevens-Johnson-Syndrome /TEN overlap syndrome (TBSA 25%, SCORTEN 5, predicted mortality >90%) associated with levofloxacin, cefixime intake, unresponsive to methylprednisolone (1 mg/kg/day) monotherapy was given tofacitinib (10 mg/day for seven days, 5 mg/day for seven days). Rapid cessation of disease progression was observed followed by 30% re-epithelialization of detached skin areas seven days later. c, 64-year-old male with laryngeal cancer under checkpoint inhibitor (Zimberelimab) therapy clinically and histologically confirmed toxic epidermal necrolysis (TBSA 30%, SCORTEN 3, predicted mortality 35.3%) associated with carboplatin. Upon admission, he was given methylprednisolone (1 mg/kg/day) and tofacitinib (10 mg/day for seven days, 5 mg/day for seven days). Rapid cessation of disease progression was observed three days later and followed by 20% re-epithelialization of detached skin areas seven days later. All H&E stained FFPE lesional skin biopsies were taken on day 0 (timepoint of hospital admission). d, pSTAT1 staining before and after JAK-inhibitor treatment, per patient. TBSA, total body surface area. Scale bars as indicated [μm].

Comment in

References

    1. Harris, V., Jackson, C. & Cooper, A. Review of toxic epidermal necrolysis. Int. J. Mol. Sci.17, 2135 (2016). - PMC - PubMed
    1. Sekula, P. et al. Comprehensive survival analysis of a cohort of patients with Stevens–Johnson syndrome and toxic epidermal necrolysis. J. Invest. Dermatol.133, 1197–1204 (2013). - PubMed
    1. Lazarou, J., Pomeranz, B. H. & Corey, P. N. Incidence of adverse drug reactions in hospitalized patients: a meta-analysis of prospective studies. JAMA279, 1200–1205 (1998). - PubMed
    1. Downey, A., Jackson, C., Harun, N. & Cooper, A. Toxic epidermal necrolysis: review of pathogenesis and management. J. Am. Acad. Dermatol.66, 995–1003 (2012). - PubMed
    1. Hoetzenecker, W. et al. Toxic epidermal necrolysis. F1000Research5, 951 (2016). - PMC - PubMed

Publication types

MeSH terms