. 2024 Oct 16;14(1):24256.
doi: 10.1038/s41598-024-75993-y.

Radiomics approach for identifying radiation-induced normal tissue toxicity in the lung

Affiliations

Radiomics approach for identifying radiation-induced normal tissue toxicity in the lung

Olivia G G Drayson et al. Sci Rep. .

Abstract

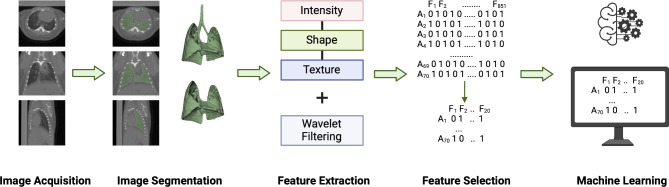
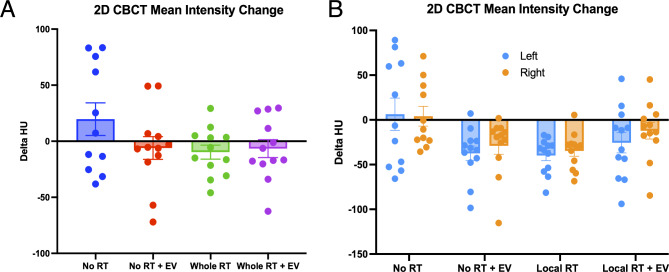
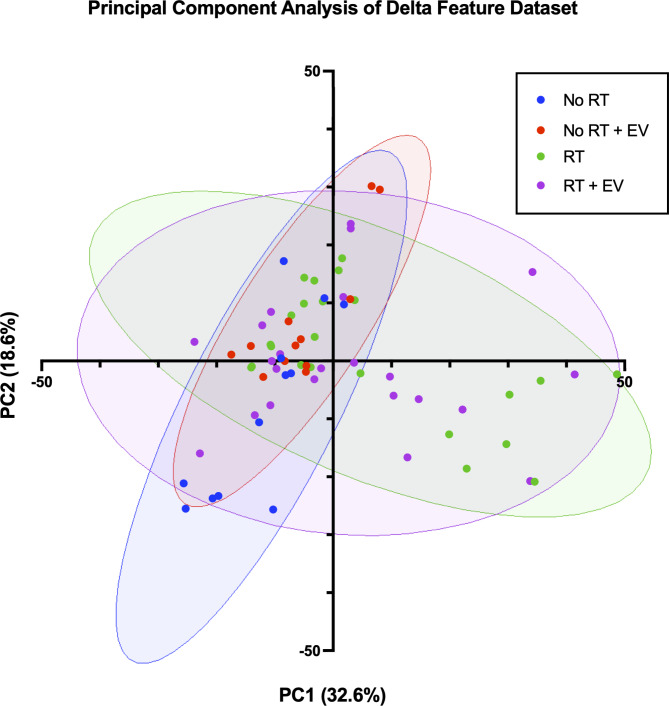
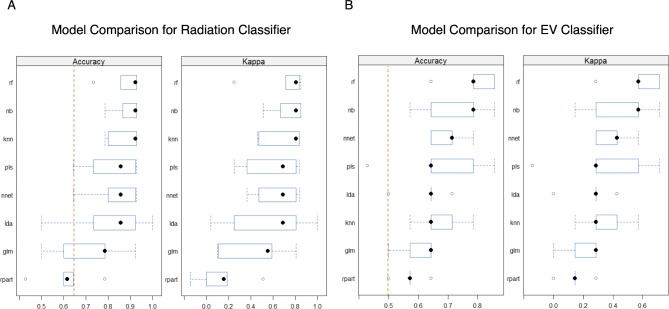
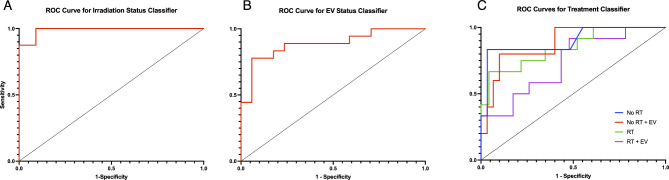
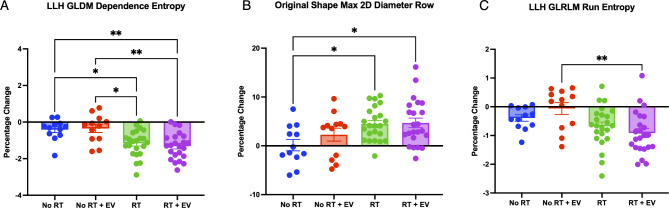
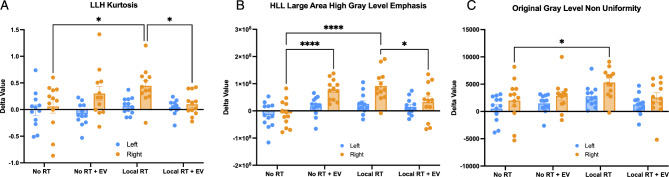
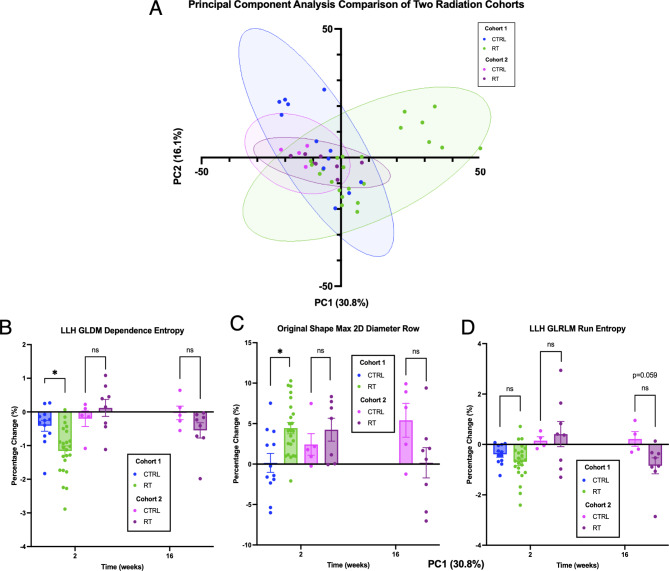
The rapidly evolving field of radiomics has shown that radiomic features are able to capture characteristics of both tumor and normal tissue that can be used to make accurate and clinically relevant predictions. In the present study we sought to determine if radiomic features can characterize the adverse effects caused by normal tissue injury as well as identify if human embryonic stem cell (hESC) derived extracellular vesicle (EV) treatment can resolve certain adverse complications. A cohort of 72 mice (n = 12 per treatment group) were exposed to X-ray radiation to the whole lung (3 × 8 Gy) or to the apex of the right lung (3 × 12 Gy), immediately followed by retro-orbital injection of EVs. Cone-Beam Computed Tomography images were acquired before and 2 weeks after treatment. In total, 851 radiomic features were extracted from the whole lungs and < 20 features were selected to train and validate a series of random forest classification models trained to predict radiation status, EV status and treatment group. It was found that all three classification models achieved significantly high prediction accuracies on a validation subset of the dataset (AUCs of 0.91, 0.86 and 0.80 respectively). In the locally irradiated lung, a significant difference between irradiated and unirradiated groups as well as an EV sparing effect were observed in several radiomic features that were not seen in the unirradiated lung (including wavelet-LLH Kurtosis, wavelet HLL Large Area High Gray Level Emphasis, and Gray Level Non-Uniformity). Additionally, a radiation difference was not observed in a secondary comparison cohort, but there was no impact of imaging machine parameters on the radiomic signature of unirradiated mice. Our data demonstrate that radiomics has the potential to identify radiation-induced lung injury and could be applied to predict therapeutic efficacy at early timepoints.

Keywords: Extracellular vesicles; Machine learning; Radiomics; Radiotherapy.


Conflict of interest statement

The authors declare no competing interests.

Figures

Fig. 1
Fig. 1
Radiomic analysis workflow for this study. Image segmentation and feature extraction were conducted in 3DSlicer. Feature selection and machine learning analysis were performed in R. No image pre-processing was conducted on this dataset prior to feature extraction.
Fig. 2
Fig. 2
Change in Mean Intensity of CBCT lung images from a single 2D slice in Osirix Lite software. (A) The change in mean intensity measured for the whole lung 2 weeks after radiotherapy (RT) and/or extracellular vesicle (EV) injection. (B) The change in mean intensity measured separately for the left and right lungs in the locally irradiated cohort.
Fig. 3
Fig. 3
Scatter plot of the two principal components with the greatest contribution to the variance in the dataset. Each datapoints represents the net feature change of an animal from baseline to week 2. Treatment status was hidden during PCA and is shown by the ellipses (blue is the unirradiated and vehicle injected control group, red is the unirradiated and EV injected group, green is the irradiated and vehicle injected group, and purple is the irradiated and EV injected group).
Fig. 4
Fig. 4
Box and whisker plots comparing accuracy and kappa score of several classification models for the Radiation and EV classifiers. Dotted red line indicates the no-information rate. rf – Random Forest, nb – Naïve Bayes, knn – k-Nearest Neighbors, pls – Partial Least Squares, nn – Neural Net, lda – Linear Discriminant Analysis, glm - Generalized Linear Model, rpart - Classification and Regression Trees (CART).
Fig. 5
Fig. 5
Receiver Operating Characteristic (ROC) Curves for the three classifiers. (A) Results of binary radiation classifier trained on features shown in first column of Table 3. (B) Results of binary EV classifier trained on features shown in third column of Table 3. (C) Results of multiclass classifier trained on features shown in second column of Table 3.
Fig. 6
Fig. 6
Bar graphs of the radiomic features which showed significant differences between treatment groups from one-way ANOVA and t-tests. (A) Plot of LLH filtered Gray Level Dependence Matrix Dependence Entropy (B) Plot of unfiltered image shape feature Maximum 2D Diameter Row (C) Plot of LLH filtered Gray Level Run Length Matrix Run Entropy.
Fig. 7
Fig. 7
Bar graphs of a set of radiomic features which demonstrated a significant EV effect not statistically different from controls at 2 weeks in the locally irradiated animals. Blue indicates the unirradiated left lung and Orange indicates the irradiated right lung. (A) Plot of LLH Intensity feature Kurtosis (B) Plot of HLL filtered Gray Level Run Length Matrix feature Large Area High Gray Level Emphasis (C) Plot of unfiltered Gray Level Size Zone Matrix feature Gray Level Non-Uniformity.
Fig. 8
Fig. 8
Comparison of the radiomic signature of the original cohort with a small independent cohort. (A) PCA of the original fractionated cohort without EV injection (from Fig. 3) and the comparison cohort. (B-D) Bar graphs of the features plotted in Fig. 6 including both the 2-week and 16-week timepoints of the comparison cohort. (A) Plot of LLH Intensity feature Kurtosis (B) Plot of HLL filtered Gray Level Run Length Matrix feature Large Area High Gray Level Emphasis (C) Plot of unfiltered Gray Level Size Zone Matrix feature Gray Level Non-Uniformity.

Update of

Similar articles

Cited by

References

    1. Lambin, P. et al. Radiomics: extracting more information from medical images using advanced feature analysis. Eur. J. Cancer Oxf. Engl. 1990. 48, 441–446 (2012). - PMC - PubMed
    1. Gillies, R. J., Kinahan, P. E. & Hricak, H. Radiomics: images are more than pictures, they are data. Radiology. 278, 563–577 (2016). - PMC - PubMed
    1. Aerts, H. J. W. L. et al. Decoding tumour phenotype by noninvasive imaging using a quantitative radiomics approach. Nat. Commun. 5, 4006 (2014). - PMC - PubMed
    1. Osapoetra, L. O. et al. Assessment of clinical radiosensitivity in patients with head-neck squamous cell carcinoma from pre-treatment quantitative ultrasound radiomics. Sci. Rep. 11, 6117 (2021). - PMC - PubMed
    1. Gardin, I. et al. Radiomics: principles and radiotherapy applications. Crit. Rev. Oncol. Hematol. 138, 44–50 (2019). - PubMed