. 2024 Nov;26(11):1997-2008.
doi: 10.1038/s41556-024-01524-6. Epub 2024 Oct 16.

Ex vivo imaging reveals the spatiotemporal control of ovulation

Affiliations

Ex vivo imaging reveals the spatiotemporal control of ovulation

Christopher Thomas et al. Nat Cell Biol. 2024 Nov.

Abstract

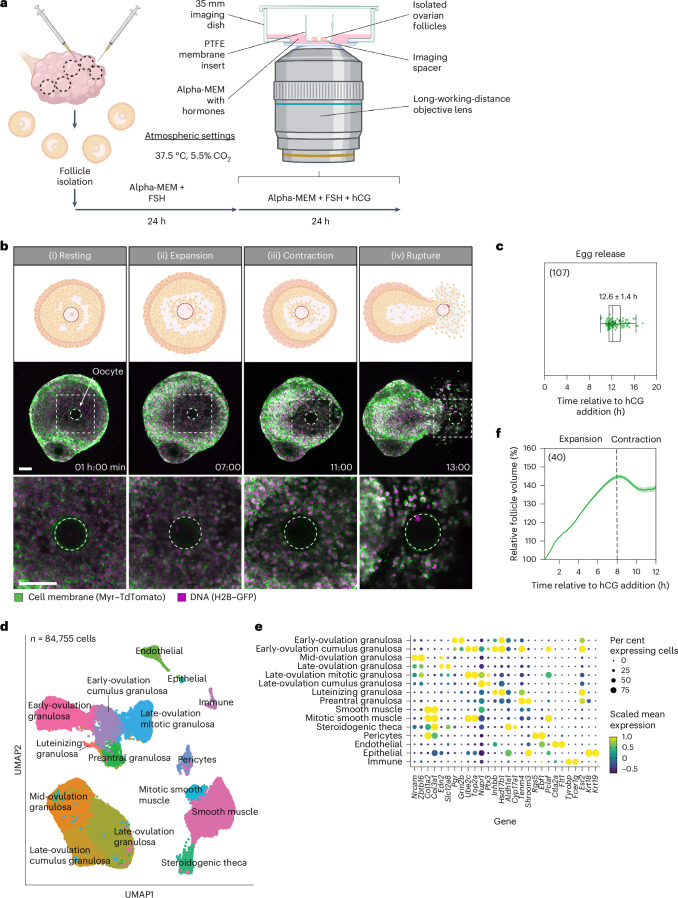
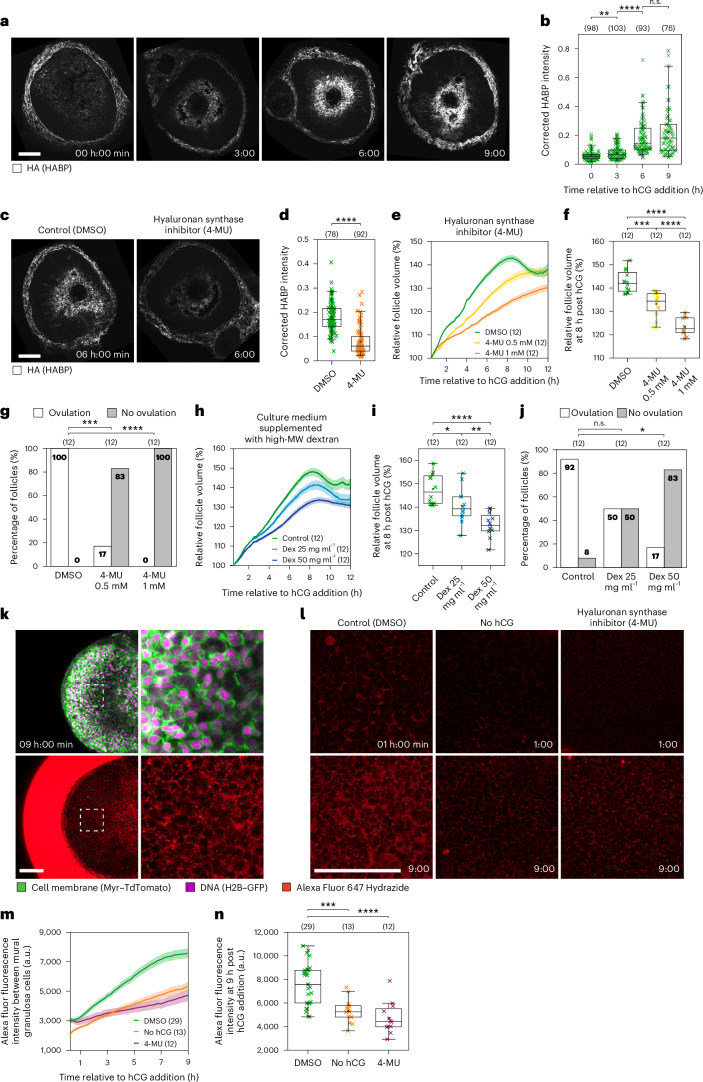
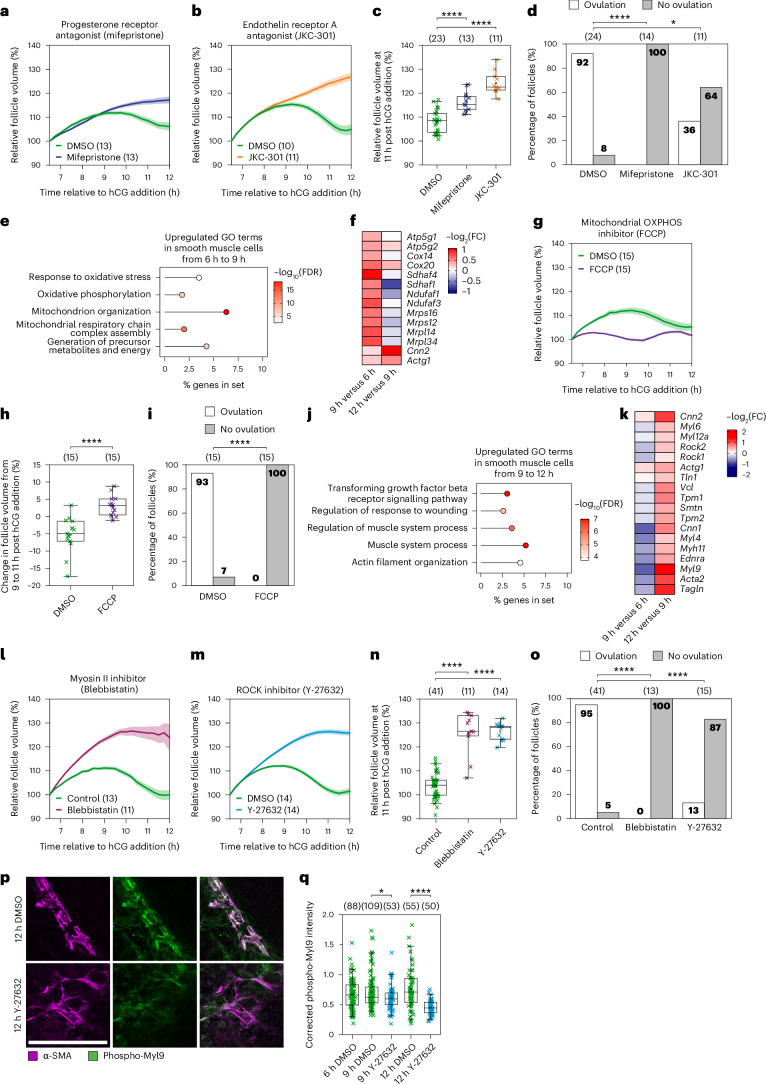
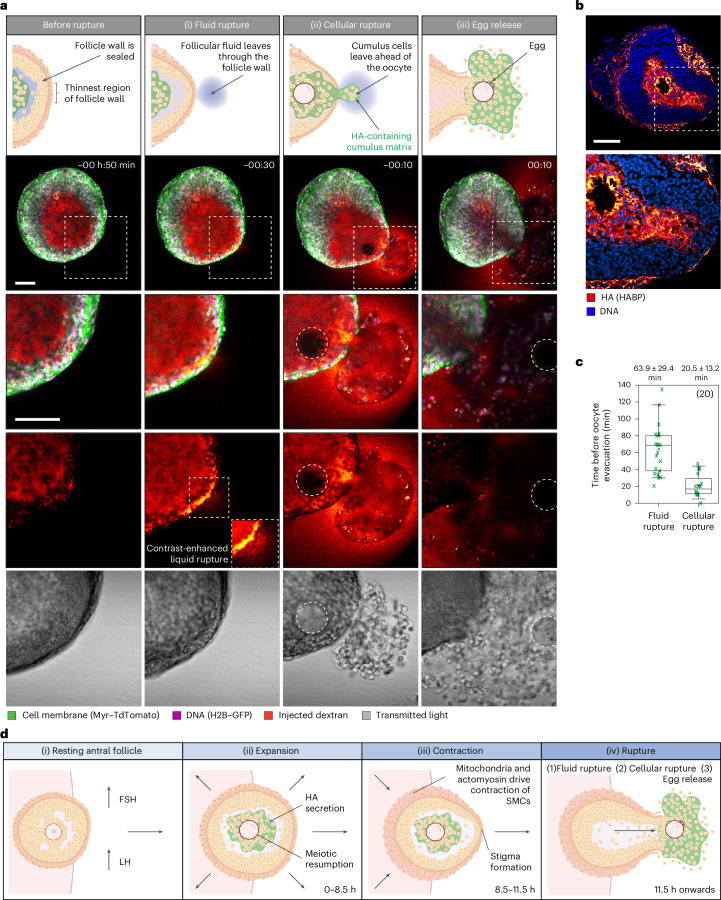
During ovulation, an egg is released from an ovarian follicle, ready for fertilization. Ovulation occurs inside the body, impeding direct studies of its progression. Therefore, the exact mechanisms that control ovulation have remained unclear. Here we devised live imaging methods to study the entire process of ovulation in isolated mouse ovarian follicles. We show that ovulation proceeds through three distinct phases, follicle expansion (I), contraction (II) and rupture (III), culminating in the release of the egg. Follicle expansion is driven by hyaluronic acid secretion and an osmotic gradient-directed fluid influx into the follicle. Then, smooth muscle cells in the outer follicle drive follicle contraction. Follicle rupture begins with stigma formation, followed by the exit of follicular fluid and cumulus cells and the rapid release of the egg. These results establish a mechanistic framework for ovulation, a process of fundamental importance for reproduction.


Conflict of interest statement

Competing interests The authors declare no competing interests.

Figures

Fig. 1
Fig. 1. Live imaging reveals follicle expansion and contraction before egg release.
a, A schematic representation of antral follicle culture and live imaging setup. b, Illustrations and representative confocal images demonstrating the phases of ovulation. The dotted white square indicates the region of inset; the dotted white circle indicates the oocyte outline; time is relative to the addition of hCG. Scale bar, 100 μm. c, A plot showing the timing of the egg release from the follicle. Total n = 107, shown in the top left of the graph, data from 17 independent biological repeats. Box, 25–75%; whiskers, 5–95%; centre, median; centre box, mean. Mean ± s.d. is displayed. d, A UMAP visualization illustrating 15 different cell types in the ovulating follicle. Both the ex vivo and the in vivo datasets and all timepoints were included in the analysis. Where cluster names include ‘early’, ‘mid’ or ‘late’ ovulation, this refers to the collection timepoints that are predominantly represented in the cluster (Extended Data Fig. 2b). e, The top highly expressed gene in each of the annotated clusters. The size of the dot corresponds to the percentage of cells in a cluster expressing the gene, while the colour indicates the mean scaled expression level of the gene in each cluster. Data in d and e are representative of three independent biological repeats. f, The relative follicle volume (each normalized to value at 0.5 h post hCG) throughout ovulation; n = 40, shown in the top left of the graph, data from 6 independent biological repeats. Created with BioRender.com. Source data
Fig. 2
Fig. 2. Follicle expansion is driven by HA secretion.
a, Representative time course of HA (HABP) staining of cryosectioned follicles collected at 0, 3, 6 and 9 h. b, The quantification of HABP mean fluorescence intensity normalized to Hoechst intensity. Total n = 370; individual groups: 0 h n = 98, 3 h n = 103, 6 h n = 93, 9 h n = 76, shown above the graph. P values: 0 h versus 3 h = 0.001558902, 3 h versus 6 h = 1.23167 × 10−14, 6 h versus 9 h = 0.095707099. c, HA staining of DMSO- and 4-MU-treated follicles at 6 h. d, The quantification of HA mean fluorescence intensity in DMSO- and 4-MU-treated follicles. Total n = 170; individual groups: DMSO n = 78, 4-MU n = 92, shown above the graph. P = 7.0863 × 10−21. e, The relative volume in DMSO- and 4-MU-treated follicles. f, A statistical comparison of the volumes in DMSO- and 4-MU-treated follicles at 8 h. P values: control versus 0.5 mM = 1.02 × 10−4, control versus 1 mM = 1.51 × 10−10, 0.5 mM versus 1 mM = 2.21 × 10−5. g, Ovulation rates in DMSO- and 4-MU-treated follicles. P values: control versus 0.5 mM = 0.00001, control versus 1 mM = 0.000194. In eg, total n = 36; individual groups: DMSO n = 12, 0.5 mM 4-MU n = 12, 1 mM 4-MU n = 12, shown above the graphs in f and g. h, The relative volume in control and dextran (Dex)-treated follicles. i, A statistical comparison of volumes in control and dextran-treated follicles at 8 h. P values: control versus 25 mg ml−1 = 1.98 × 10−2, control versus 50 mg ml−1 = 1.96 × 10−6, 25 mg ml−1 versus 50 mg ml−1 = 4.97 × 10−3. j, Ovulation rates in control and dextran-treated follicles. P values: control versus 25 mg ml−1 = 0.160586, control versus 50 mg ml−1 = 0.001048. In hj, total n = 36; individual groups: control n = 12, 25 mg ml−1 dextran n = 12, 50 mg ml−1 dextran n = 12, shown above the graphs in i and j. k, Representative confocal images of AF647 Hydrazide uptake by the follicle at 9 h. The dotted white square indicates the region of inset. l, Representative confocal images of AF647 Hydrazide uptake by DMSO-, no hCG- and 4-MU-treated follicles at 1 and 9 h. m, The AF647 fluorescence intensity in DMSO-, no hCG- and 4-MU-treated follicles. n, A statistical comparison of AF647 fluorescence intensity in DMSO-, no hCG- and 4-MU-treated follicles at 9 h. P values: control versus no hCG = 1.24 × 10−4, control versus 4-MU = 1.15 × 10−5. In m,n, total n = 54; individual groups: DMSO n = 29, no hCG n = 13, 4-MU n = 12, shown above the graph in n. Data in an are representative of two independent biological repeats. In e, h and m, the thick lines show the mean, and the lighter shadows show the s.e.m. In b, d, f, i and n: ****P < 0.0001, ***P < 0. 001, **P < 0.01, n.s. non-significant, two-sided unpaired t-test; box, 25–75%; whiskers, 5–95%; centre, median; centre box, mean. In g and j: chi-square test (two-sided) with Yates’s correction. All times are relative to hCG addition. All scale bars, 100 μm. Source data
Fig. 3
Fig. 3. Follicle contraction is mediated by smooth muscle cells.
a, The relative volume of DMSO- and mifepristone-treated follicles. Total n = 26; individual groups: DMSO n = 13, mifepristone n = 13. b, The relative volume of DMSO- and JKC-301-treated follicles. Total n = 21; individual groups: DMSO n = 10, JKC-301 n = 11. c, The relative volume at 11 h of DMSO-, mifepristone- and JKC-301-treated follicles. P values: control versus mifepristone = 6.13 × 10−6, control versus JKC-301 = 1.29 × 10−10. d, The ovulation rate in DMSO-, mifepristone- and JKC-301-treated follicles. P values: control versus mifepristone = 0.000027, control versus JKC-301 = 0.008636. In c,d, total n = 47; individual groups: DMSO n = 23, mifepristone n = 13, JKC-301 n = 11, as shown above the graphs. e, Upregulated GO terms in smooth muscle cells from 6 to 9 h. FDR, false discovery rate. f, A condensed heatmap of mitochondrial respiratory chain gene expression in smooth muscle cells during follicle contraction. g, The relative volume of DMSO- and FCCP-treated follicles. DMSO n = 15, FCCP n = 15. OXPHOS, oxidative phosphorylation. h, The change in relative volume between 9 h and 11 h of DMSO- and FCCP-treated follicles. P = 6.56 × 10−6. i, The ovulation rate in DMSO- and FCCP-treated follicles. P = 0.00001. In h,i, total n = 30; individual groups: DMSO n = 15, FCCP n = 15, as shown above the graphs. j, Upregulated GO terms in smooth muscle cells from 9 to 12 h. FDR, false discovery rate. k, A heatmap of actomyosin contraction gene expression in smooth muscle cells during follicle contraction. l, The relative volume of control ((+) blebbistatin inactive enantiomer) and blebbistatin ((−) blebbistatin active enantiomer)-treated follicles. Total n = 24; individual groups: Control n = 13, blebbistatin n = 11. m, The relative volume of DMSO- and Y-27632-treated follicles. Total n = 28; individual groups: DMSO n = 14, Y-27632 n = 14. n, The relative volume at 11 h of control and blebbistatin- and Y-27632-treated follicles. P values: control versus blebbistatin = 1.98 × 10−14, control versus Y-27632 = 7.94 × 10−21. Total n = 66; individual groups: Control n = 41, blebbistatin n = 11, Y-27632 n = 14, as shown above the graph. o, The ovulation rate in control and blebbistatin- and Y-27632-treated follicles. P values: control versus blebbistatin = 0, control versus Y-27632 = 0.000016. Total n = 69; individual groups: DMSO n = 41, blebbistatin n = 13, Y-27632 n = 15, as shown above the graph. p, Representative images of α-SMA and phospho-Myl9 staining in cryosectioned follicles collected at 12 h ± Y-27632. Scale bar, 100 μm. q, Quantification of phospho-Myl9 mean fluorescence intensity in the outer follicle normalized to the mean fluorescence intensity of α-SMA at 6, 9 and 12 h ± Y-27632. 6 h DMSO n = 88, 9 h DMSO n = 109, 9 h Y-27632 n = 53, 12 h DMSO n = 55, 12 h Y-27632 n = 50, as shown above the graph. P values: 9 h control versus Y-27632 = 0.03368, 12 h control versus Y-27632 = 2.37 × 10−8. Data in ad, gi and lq are representative of two independent biological repeats. Data in e, f, j and k are representative of three independent biological repeats. In a, b, g, l and m, the thick lines show the mean, and the lighter shadows show the s.e.m. In c, h, n and q: ****P < 0.0001, ***P < 0. 001, **P < 0.01, n.s. non-significant, two-sided unpaired t-test; box, 25–75%; whiskers, 5–95%; centre, median; centre box, mean. In d, i and o: chi-square test (two-sided) with Yates’s correction. All times are relative to hCG addition. Source data
Fig. 4
Fig. 4. Stigma formation precedes follicle rupture.
a, Representative time course confocal images of stigma formation. Time is relative to the rupture of the follicle wall. Scale bar, 100 μm. b, A schematic explaining measurements made in cg. c, The mean maximum follicle width during stigma formation. d, The mean maximum follicle length during stigma formation. e, The mean follicle length/width ratio during stigma formation. f, The mean maximum follicle perimeter during stigma formation. g, The mean apical wall thickness during stigma formation. h, A schematic illustration explaining how thickness measurements were made in i. i, The theca layer thickness on future rupture site and rest of the follicle at 0.5, 6.5 and 9.5 h after hCG addition. P values: 0 h = 2.93 × 10−3, 6 h = 2.77 × 10−5, 9 h = 2.41 × 10−4. Data in a and cg are representative of 14 control follicles, as shown in the top left of the graphs over 2 independent biological repeats. In cg, the thick lines show the mean, and the lighter shadows show the s.e.m. Data in i are from 12 follicles, as shown in the bottom left of the graph over 4 independent biological repeats. In i: ***P < 0. 001; ****P < 0.0001, two-sided unpaired t-test; box, 25–75%; whiskers, 5–95%; centre, median; centre box, mean. Created with BioRender.com. Source data
Fig. 5
Fig. 5. Follicle rupture is a three-step process.
a, Illustrations and representative confocal images of fluid rupture, cellular rupture and egg release. Inset: contrast-enhanced injected dextran channel to better visualize fluid rupture. The dotted white square indicates the region of inset; the dotted white circle indicates the oocyte outline; time is relative to the egg release. Scale bar, 100 μm. b, Immunofluorescence images of cryosectioned follicle collected during stigma formation at 12 h after hCG and stained for HA using HABP. Scale bar, 100 μm. The images are representative of two independent biological repeats. c, The timing of fluid rupture and cellular rupture relative to egg release. Box, 25–75%; whiskers, 5–95%; centre, median; centre box, mean. Total n = 20, as shown in the top right of the graph. d, A model for the ovulation mechanism. (i) FSH drives follicle growth to the antral stage. Ovulation is initiated by a mid-cycle surge in LH. (ii) HA secretion drives cumulus and follicle expansion. The oocyte resumes meiosis I. (iii) Smooth muscle cells mediate follicle contraction. The follicle distends to form a stigma. (iv) The follicle wall thins and ruptures. The egg and cumulus mass are released from the follicle. Data in a and c are representative of seven independent biological repeats. Created with BioRender.com. Source data
Extended Data Fig. 1
Extended Data Fig. 1. Live imaging reveals follicle expansion and contraction prior to egg release (extended data).
(a) Schematic representation of strategy for confocal imaging. (b) Schematic representation of strategy for 2-photon imaging for 3D reconstructions. (c) Representative time course of 3D-reconstructed follicles during ovulation. Time relative to hCG addition; scale bar, 100 μm. Created with BioRender.com.
Extended Data Fig. 2
Extended Data Fig. 2. Cluster distribution for single-cell transcriptomic map of murine ovulation.
(a) Bar plot showing the distribution of cell types between in vivo and ex vivo samples. Most cell types are represented to equivalent extents in both samples, with the exception of luteinising granulosa cells and immune cells which both rely on access to factors derived from outside the follicle during ovulation. (b) Bar plot showing the relative contribution of the collection time points to each cluster. All data is representative of 3 independent biological repeats. Source data
Extended Data Fig. 3
Extended Data Fig. 3. Temporal expression of ovulation-related genes in the in vivo and ex vivo datasets.
(a-b) Violin plots showing the global changes in expression level of ovulation-related genes across all cell types at 0, 3, 6, 9, and 12 h post hCG administration in both in vivo and ex vivo datasets. At 0 h, prior to hCG administration, the in vivo samples already show expression of genes known to be downstream of LH, such as Pgr. This can be explained by previous findings that PMSG injection into mice can cause a spontaneous endogenous LH surge in mice. We therefore excluded the 0 hour time point for all downstream analysis (Fig. 1d, e and further analyses focusing on cell-type specific transcriptomic changes during ovulation). (c) Area-proportional Venn diagrams showing the global transcriptomic overlap between the in vivo and ex vivo datasets at 3, 6, 9, and 12 h post hCG administration. Differential gene expression analysis was performed with the LRT test. For the global comparison of the two setups at each time point, the Wald test in DESeq2 v1.32.0 was used. A gene was considered to be upregulated in the dataset if its |avglog2FC | ≥ 0.5 and adjusted p-value < 0.01. All data is representative of 3 independent biological repeats. Source data
Extended Data Fig. 4
Extended Data Fig. 4. Control follicle volume analysis.
(a) Graph showing absolute follicle volume, non-normalised. (b) Graph showing follicle volume normalised at 0.5 h post hCG addition. (c) Graph showing absolute follicle volume of control follicles ordered into 5 groups by their starting volume. (d) Graph showing volume of control follicles ordered by their starting volume, normalised at 0.5 h post hCG addition. In panels (a,b), thin traces show raw values from individual follicles; thick traces show the mean. In panels (c,d), thick lines show the mean, lighter shadows show the SEM. Panels (a,b,c,d), contain data from 40 follicles from 6 independent biological repeats. Each group in panels (c,d) contains 8 follicles. Source data
Extended Data Fig. 5
Extended Data Fig. 5. Follicle expansion is driven by hyaluronic acid secretion (extended data).
(a) Representative image of hyaluronic acid (HA) using HA-Binding Protein (HABP) staining of cryosectioned whole ovaries collected at 0, 3, and 6 h post hCG addition. Scale bar, 100 μm. (b) Quantification of HABP mean fluorescence intensity in the inner follicle normalised to Hoechst intensity. 0 h n = 91, 3 h n = 71, 6 h n = 75. Box = 25-75%, whiskers = 5-95%, centre = median, centre box = mean. P values: 0v3h = 2.62364E-06, 3v6h = 3.87849E-22. (c) Violin plot showing Has2 expression in cumulus granulosa cells during ovulation. Box = 25-75%, whiskers = min and max, centre = median. P values = Early ovulation cumulus granulosa cells 3v6 = <2.22E-16, 6v9 = 0.017, 9v12 = 0.16; Late ovulation cumulus granulosa cells 3v6 = 0.0081, 6v9 = <2.22E-16, 9v12 = 0.13. (d) Graph showing absolute volume, non-normalised, in DMSO and 4-MU-treated follicles. (e) Graph showing volume normalised at 0.5 h post hCG addition in DMSO and 4-MU-treated follicles. Panels (d,e): total n = 36; individual groups: DMSO n = 12, 0.5 mM 4-MU n = 12, 1 mM 4-MU n = 12. (f) Graph showing absolute volume, non-normalised, in DMSO and dextran-treated follicles. (g) Graph showing volume normalised at 0.5 h post hCG addition in DMSO and dextran-treated follicles. Panels (f,g): total n = 36; individual groups: DMSO n = 12, 25 mg/ml dextran n = 12, 50 mg/ml dextran n = 12. Data in panels (a,b,d,e,f,g) representative of 2 independent biological repeats. Data in (c) representative of 3 independent biological repeats. In panels (b,c): ****P < 0.0001, ***P < 0. 001, **P < 0.01, n.s. non-significant, two-sided unpaired t-test. In panels (d,e,f,g): thin traces show raw values from individual follicles; thick traces show the mean. Source data
Extended Data Fig. 6
Extended Data Fig. 6. Follicle contraction is mediated by smooth muscle cells (extended data).
(a) Graph showing absolute volume, non-normalised, in DMSO and mifepristone-treated follicles. (b) Graph showing volume normalised at 6.5 h post hCG addition in DMSO and mifepristone-treated follicles. Panels (a,b): total n = 26; individual groups: DMSO n = 13, mifepristone n = 13. (c) Graph showing absolute volume, non-normalised, in DMSO and JKC-301-treated follicles. (d) Graph showing volume normalised at 6.5 h post hCG addition in DMSO and JKC-301-treated follicles. Panels (c,d): total n = 21; individual groups: DMSO n = 10, JKC-301 n = 11. (e) Graph showing absolute volume, non-normalised, in DMSO and FCCP-treated follicles. (f) Graph showing volume normalised at 6.5 h post hCG addition in DMSO and FCCP-treated follicles. Panels (e,f): total n = 30; individual groups: DMSO n = 15, FCCP n = 15. (g) Graph showing absolute volume, non-normalised, in control and blebbistatin-treated follicles. (h) Graph showing volume normalised at 6.5 h post hCG addition in control and blebbistatin-treated follicles. Panels (g,h): total n = 24; individual groups: DMSO n = 13, blebbistatin n = 11. (i) Graph showing absolute volume, non-normalised, in DMSO and Y-27632-treated follicles. (j) Graph showing volume normalised at 6.5 h post hCG addition in DMSO and Y-27632-treated follicles. Panels (i,j): total n = 28; individual groups: DMSO n = 14, Y-27632 n = 14. (k) Representative whole follicle image of α-SMA and phospho-Myl9 staining of cryosectioned follicles collected at 6, 9, and 12 h post hCG addition. Here, the 9 hour timepoint is shown. (l) Representative image of α-SMA and phospho-Myl9 staining of cryosectioned whole ovaries collected at 6, 9, and 12 h post hCG addition. Here, the 12 h timepoint is shown. Data in panels (a,b,c,d,e,f,g,h,i,j,k,l) representative of 2 independent biological repeats. In panels (a,b,c,d,e,f,g,h,i,j): thin traces show raw values from individual follicles; thick traces show the mean. Source data
Extended Data Fig. 7
Extended Data Fig. 7. Genes related to the mitochondrial respiratory chain are upregulated in smooth muscle cells at the start of follicle contraction.
Expanded heatmap of mitochondrial respiratory chain gene expression in smooth muscle cells during follicle contraction including genes for components of (a) ATP synthase, (b) Cytochrome C Oxidase, (c) Succinate dehydrogenase complex, (d) Ubiquinol-Cytochrome C Reductase Complex, (e) NADH dehydrogenase, (f) Mitoribosome small subunit and (g) mitoribosome large subunit. All data is representative of 3 independent biological repeats. Source data
Extended Data Fig. 8
Extended Data Fig. 8. MMP activity is required for follicle rupture but not expansion or contraction.
(a) Violin plot showing Mmp2 expression in smooth muscle cells during ovulation. Box = 25-75%, whiskers = min and max, centre = median. P values = 3v6 = 1.5E-15, 6v9 = 6.7E-08, 9v12 = <2.22E-16. (b) Relative volume in control (DMSO) and SB-3CT-treated follicles. (c) Graph showing absolute volume, non-normalised, in DMSO and SB-3CT-treated follicles. (d) Graph showing volume normalised at 1.5 h post hCG addition in DMSO and SB-3CT-treated follicles. Panels (b,c,d): total n = 21; individual groups: DMSO n = 10, SB-3CT n = 11. (e) Quantification of ovulation rate in DMSO and SB-3CT-treated follicles. Data from 42 follicles; individual groups: DMSO n = 20, SB-3CT n = 22. P = 0.009216. (f) Quantification of the average timing of egg release in DMSO and SB-3CT-treated follicles. Data from 38 follicles; individual groups: DMSO n = 22, SB-3CT n = 16. Box = 25-75%, whiskers = 5-95%, centre = median, centre box = mean. Mean ± s.d. is displayed. P = 2.53E-04. (g) Representative confocal images of rupture formation in DMSO and SB-3CT-treated follicles. Data in (a) is representative of 3 independent biological repeats. Data in panels (b,c,d) is representative of 2 independent biological repeats. Data in panels (e,f) is representative of 4 independent biological repeats. In panels (a,f): ****P < 0.0001, ***P < 0. 001, **P < 0.01, n.s. non-significant, two-sided unpaired t-test. In panel (e), chi-square test (two-sided) with Yates’s correction. In panel (a): thick lines show the mean, lighter shadows show the SEM. In panels (c,d): thin traces show raw values from individual follicles; thick traces show the mean. Source data
Extended Data Fig. 9
Extended Data Fig. 9. Rapid oocyte propulsion through the newly formed rupture site.
(a) Representative confocal time course of oocyte movement out of the follicle. Dotted white square indicates region of inset; dotted white circle indicates oocyte outline; time relative to hCG addition; scale bar, 100 μm. (b) Schematic illustration showing the confocal imaging strategy for generating the 3D dataset for oocyte tracking. (c) Representative images of oocyte surface reconstruction through ovulation in isolated follicles expressing the oocyte marker Oct4-GFP. Green line shows the track of its movement in 3D during ovulation; green surface shows the oocyte. Time relative to hCG addition; scale bar, 100 μm. (d) Distance moved by the oocyte per 10 minute time interval during ovulation; n = 10. (e) Total distance moved by the oocyte; n = 10. (f) Plot showing maximum oocyte speed moving out of the follicle. Data in (c,d,e,f) is representative of 3 independent biological repeats. In panel (f): Box = 25-75%, whiskers = 5-95%, centre = median, centre box = mean. In panels (d,e): thick lines show the mean data, lighter shadows show the SEM. Created with BioRender.com. Source data
Extended Data Fig. 10
Extended Data Fig. 10. Meiotic resumption is not essential for ovulation.
(a) Quantification of NEBD timing relative to hCG addition in control follicles. Only data from follicles that ovulated was included in this quantification; n = 59 from 14 independent biological repeats. Box = 25-75%, whiskers = 5-95%, centre = median, centre box = mean. Mean NEBD timing is displayed: 3.8 ± 1.6 h (s.d.) (b) Relative volume in control (DMSO) and cilostamide-treated follicles. (c) Graph showing absolute volume, non-normalised, in DMSO and cilostamide-treated follicles. (d) Graph showing volume normalised at 0.5 h post hCG addition in DMSO and cilostamide-treated follicles. (e) Quantification of ovulation rate in DMSO and cilostamide-treated follicles. Panels (b,c,d,e): total n = 31; individual groups: DMSO n = 16, cilostamide n = 15. P = 1. (f) Representative confocal images of ovulated GV oocyte in PDE3-inhibitor (cilostamide)-treated follicle. Data in panels (b,c,d,e,f) is representative of 2 independent biological repeats. In panel (e), chi-square test (two-sided) with Yates’s correction. ****P < 0.0001, ***P < 0. 001, **P < 0.01, n.s. non-significant, two-sided unpaired t-test. In panel (b): thick lines show the mean, lighter shadows show the SEM. In panels (c,d): thin traces show raw values from individual follicles; thick traces show the mean. Source data

References

    1. Jaffe, L. A. & Egbert, J. R. Regulation of mammalian oocyte meiosis by intercellular communication within the ovarian follicle. Annu. Rev. Physiol.79, 237–260 (2017). - PMC - PubMed
    1. Duffy, D. M., Ko, C., Jo, M., Brannstrom, M. & Curry, T. E. Ovulation: parallels with inflammatory processes. Endocr. Rev.40, 369–416 (2019). - PMC - PubMed
    1. Palanisamy, G. S. et al. A novel pathway involving progesterone receptor, endothelin-2, and endothelin receptor B controls ovulation in mice. Mol. Endocrinol.20, 2784–2795 (2006). - PubMed
    1. Ko, C. M. et al. Endothelin-2 in ovarian follicle rupture. Endocrinology147, 1770–1779 (2006). - PubMed
    1. Lydon, J. P., DeMayo, F. J., Conneely, O. M. & O’Malley, B. W. Reproductive phenotypes of the progesterone receptor null mutant mouse. J. Steroid Biochem. Mol. Biol.56, 67–77 (1996). - PubMed

Publication types

Substances

LinkOut - more resources