. 2024 Oct 17;43(1):286.
doi: 10.1186/s13046-024-03210-9.

Targeting cancer-associated fibroblasts/tumor cells cross-talk inhibits intrahepatic cholangiocarcinoma progression via cell-cycle arrest

Affiliations

Targeting cancer-associated fibroblasts/tumor cells cross-talk inhibits intrahepatic cholangiocarcinoma progression via cell-cycle arrest

Serena Mancarella et al. J Exp Clin Cancer Res. .

Abstract

Background: Cancer-associated fibroblasts (CAFs), mainly responsible for the desmoplastic reaction hallmark of intrahepatic Cholangiocarcinoma (iCCA), likely have a role in tumor aggressiveness and resistance to therapy, although the molecular mechanisms involved are unknown. Aim of the study is to investigate how targeting hCAF/iCCA cross-talk with a Notch1 inhibitor, namely Crenigacestat, may affect cancer progression.

Methods: We used different in vitro models in 2D and established new 3D hetero-spheroids with iCCA cells and human (h)CAFs. The results were confirmed in a xenograft model, and explanted tumoral tissues underwent transcriptomic and bioinformatic analysis.

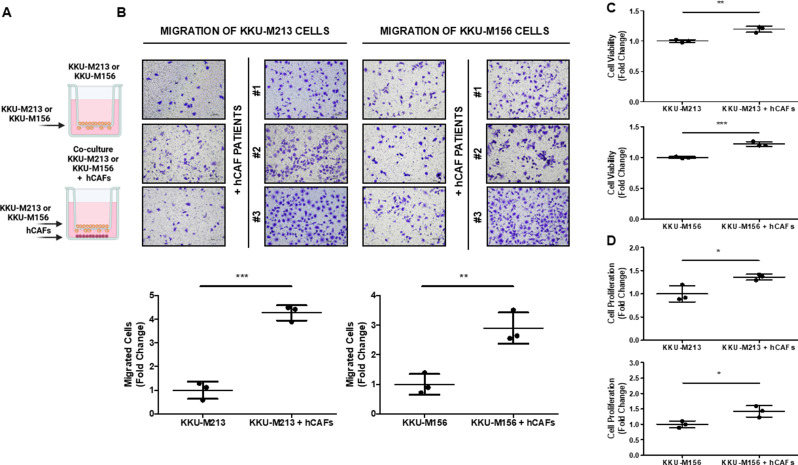
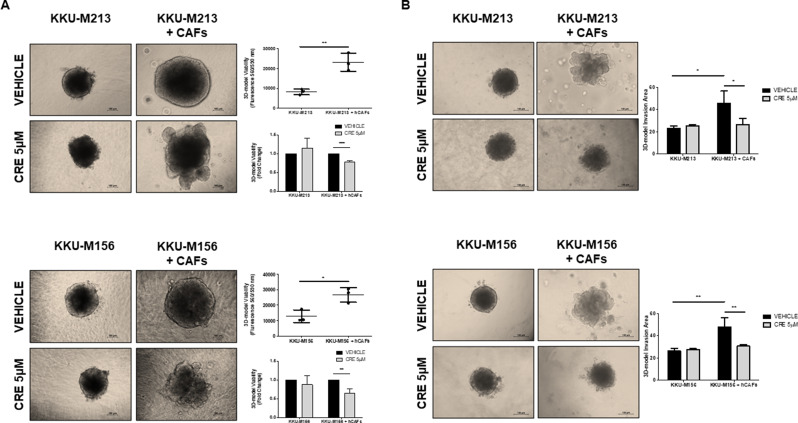
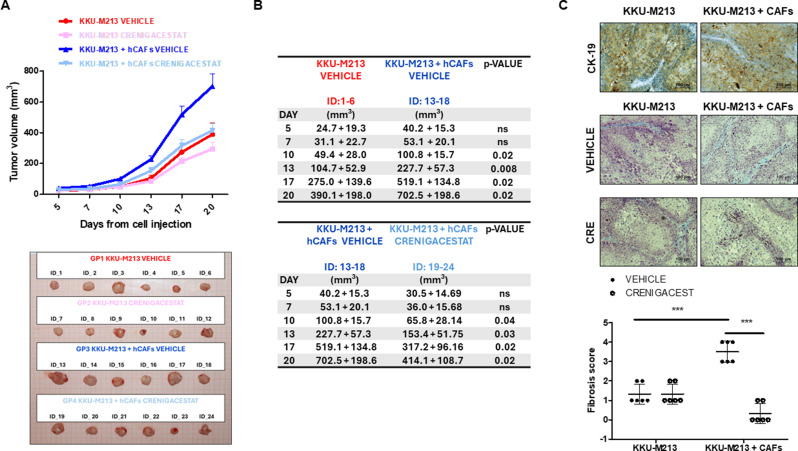
Results: hCAFs/iCCA cross-talk sustains increased migration of both KKU-M213 and KKU-M156 cells, while Crenigacestat significantly inhibits only the cross-talk stimulated migration. Hetero-spheroids grew larger than homo-spheroids, formed by only iCCA cells. Crenigacestat significantly reduced the invasion and growth of hetero- but not of homo-spheroids. In xenograft models, hCAFs/KKU-M213 tumors grew significantly larger than KKU-M213 tumors, but were significantly reduced in volume by Crenigacestat treatment, which also significantly decreased the fibrotic reaction. Ingenuity pathway analysis revealed that genes of hCAFs/KKU-M213 but not of KKU-M213 tumors increased tumor lesions, and that Crenigacestat treatment inhibited the modulated canonical pathways. Cell cycle checkpoints were the most notably modulated pathway and Crenigacestat reduced CCNE2 gene expression, consequently inducing cell cycle arrest. In hetero-spheroids, the number of cells increased in the G2/M cell cycle phase, while Crenigacestat significantly decreased cell numbers in the G2/M phase in hetero but not in homo-spheroids.

Conclusions: The hCAFs/iCCA cross-talk is a new target for reducing cancer progression with drugs such as Crenigacestat.

Keywords: Cholangiocarcinoma progression; Gamma secretase inhibitor; Liver cancer; Tumor microenvironment; Tumor stroma.


Conflict of interest statement

The authors declare that they have no conflict of interest.

Figures

Fig. 1
Fig. 1
hCAFs promoted the migration and viability of iCCA cells in co-culture conditions. (A). Schematic representation of the experimental model of KKU-M213 and KKU-M156 migration without and with hCAFs. (B). Representative images of KKU-M213 (panels on the left) and KKU-M156 cells (panels on the right) migrated alone or in co-culture with three hCAFs (#1, #2, #3) using the transwell migration system. The migration of both iCCA cell lines was significantly increased after co-culture with hCAFs. Cells that migrated were counted in five random microscope fields for each sample (10× magnification, scale bar 100 μm). (C). The KKU-M213 and KKU-M156 cell viability was evaluated by CyQUANT™ XTT Cell Viability kit. The viability of both iCCA cells was significantly increased in co-culture with hCAFs. (D). The KKU-M213 and KKU-M156 cell proliferation was evaluated by Trypan Blue cell counting. Numbers of both iCCA cells were significantly increased in co-culture with hCAFs. Data are expressed as the mean ± SD of three independent experiments with three hCAFs. *p < 0.05 **p < 0.01 and ***p < 0.001
Fig. 2
Fig. 2
Crenigacestat effectiveness on hCAFs/iCCA cells cross-talk migration. (A). Schematic representation of the experimental model of KKU-M213 and KKU-M156 migration without and with hCAFs treated with Crenigacestat (5 µM). (B). Transwell migration assays showed that Crenigacestat significantly reduced the migration of A) KKU-M213 and B) KKU-M156 cells in co-culture with three hCAFs (#1, #2, #3) compared to the vehicle. The number of migrated cells was quantified in five random microscope fields for each treatment in experiments performed three times with three hCAFs. (10× magnification, scale bar 100 μm). (C). KKU-M213 and KKU-M156 cell viability treated with Crenigacestat (5 µM) was evaluated with the CyQUANT™ XTT Cell Viability kit. Crenigacestat did not affect the viability of both iCCA cells in culture with or without hCAFs. (D). The KKU-M213 and KKU-M156 cell proliferation was evaluated with Trypan Blue. Crenigacestat did not significantly influence the number of both iCCA cells in culture with or without hCAFs. Values are presented as mean ± SD. **p < 0.01 and ***p < 0.001
Fig. 3
Fig. 3
Immunofluorescence characterization of 3D-hCAFs/iCCA spheroids. (A). Representative confocal microscopy images of homo- and hetero-spheroids established by KKU-M213 and KKU-M156 alone or in co-culture with hCAFs. The EpCAM marker, considered an epithelial-specific marker, is shown as a green fluorescent signal. The FAP marker, used as a specific marker for fibroblast activation, is shown as a red fluorescent signal. (B). Positive staining for Ki-67 indicates cell proliferation and demonstrates that hCAFs influence proliferation in hetero-spheroids. Nuclei are shown as a blue fluorescent signal stained with DAPI. (20× magnification, scale bar 100 μm)
Fig. 4
Fig. 4
Effect of Crenigacestat on hCAFs/iCCA cell spheroids viability and invasion assay. The composite hydrogels formed a 3D environment that allows A) the viability or B) invasion of cells. hCAFs promote growth, viability, invasion and migration of KKU-M213 and KKU-M156 hetero-spheroids compared to homo-spheroids. Crenigacestat treatment inhibited viability, invasion and migration of KKU-M213 and KKU-M156 spheroids co-cultured with hCAFs. (10× magnification, scale bar 100 μm). Experiments were performed three times with three hCAFs. Values are presented as mean ± SD. *p < 0.05; **p < 0.01 and ***p < 0.001
Fig. 5
Fig. 5
Crenigacestat reduced iCCA progression promoted by hCAFs/iCCA cells cross-talk in the xenograft model. (A-B). The tumor volumes were evaluated in nude mice co-injected with KKU-M213 and hCAFs cells. Only KKU-M213 cells were injected into the control group. hCAFs that were co-injected with iCCA cells enhanced tumor growth. Crenigacestat significantly reduced the tumor progression induced by hCAFs, compared with the control (vehicle). Data are presented as the mean ± SD. N = 6 mice per group; *p < 0.05, p-values were obtained using the Mann-Whitney U Test. (C). Immunohistochemical staining showed a similar CK-19 expression pattern in both tumor models (upper panel). Masson’s trichrome staining shows different amounts of intercellular collagenous matrix in the two models, with and without Crenigacestat treatment (lower panel). An adapted METAVIR was used to quantify the fibrosis in treated and untreated mice, as reported in the graphs. The staining quantification was calculated as the mean intensity staining of the whole section from the KKU-M213 and KKU-M213/hCAFs tumors of each mouse treated with Crenigacestat compared to vehicle
Fig. 6
Fig. 6
Transcriptomic profiling of explanted tumor masses. (A) PCA and hierarchical clustering heatmap using DEGs shows a clear separation of masses explanted from the xenograft model derived from co-injection of KKU-M213 and hCAFs with those derived from only KKU-M213. (B) PCA and the hierarchical clustering heatmap using DEGs showed a clear separation of masses explanted from co-injection of KKU-M213 and hCAFs with and without Crenigacestat treatment. Each row represents a gene, and each column represents a sample. The expression levels of genes are indicated by the color bar above the heatmap. Increased expression is shown in red whereas decreased expression is shown in green. IPA results using the annotations “Disease & Function” revealed that most genes were involved in Hepatic System Diseases in the comparison between KKU-M213 vehicle and hCAFs vs. KKU-M213 vehicle (C) and in the comparison of KKU-M213 + hCAF vehicle vs. KKU-M213 + hCAF Crenigacestat vs. KKU-M213 + hCAF vehicle (D). Results are visualized as a hierarchical heatmap where the boxes represent a category of related functions. Each colored rectangle represents a particular biological function or disease, and the color indicates the state of prediction: increase (orange) and decrease (blue)
Fig. 7
Fig. 7
Crenigacestat affected in vivo tumor growth, inhibiting CCNE2E2 cyclin. (A). Top 20 significant pathways from DEGs involved in the reduction of liver lesions after Crenigacestat treatment in the xenograft model derived from co-injection of KKU-M213 with hCAFs. (B). List of 37 DEGs modulated by Crenigacestat and involved in the cell cycle checkpoints. (C). Schematic representation of Crenigacestat modulation of CCNE2 expression and downstream effects on cell-cycle progression. (D). CCNE2 and CCND1 mRNA expression levels on masses of the xenograft model derived from co-injection of KKU-M213 and hCAFs, by quantitative real-time PCR. ***p < 0.001
Fig. 8
Fig. 8
Crenigacestat induced hetero-spheroids cell cycle arrest in the G0/G1 phase. A. Cell cycle distribution of KKU-M213 and KKU-M213 with hCAFs spheroids treated with vehicle or Crenigacestat for 96 h was examined by flow cytometry. An increased G2/M cell cycle phase was observed in hetero-spheroids compared to homo-spheroids and Crenigacestat treatment induced a G0/G1 cell cycle arrest in hetero-spheroids compared to vehicle. The calculated percentage of cell cycle distribution was presented as mean ± SD from three independent experiments

References

    1. Saha SK, Zhu AX, Fuchs CS, Brooks GA. Forty-year trends in Cholangiocarcinoma Incidence in the U.S.: Intrahepatic Disease on the rise. Oncologist. 2016;21:594–9. - PMC - PubMed
    1. Endo I, Gonen M, Yopp AC, Dalal KM, Zhou Q, Klimstra D, et al. Intrahepatic cholangiocarcinoma: rising frequency, improved survival, and determinants of outcome after resection. Ann Surg. 2008;248:84–96. - PubMed
    1. Banales JM, Marin JJG, Lamarca A, Rodrigues PM, Khan SA, Roberts LR et al. Cholangiocarcinoma 2020: the next horizon in mechanisms and management. Nat Rev Gastroenterol Hepatol Nat Res; 2020. pp. 557–88. - PMC - PubMed
    1. Valle J, Wasan H, Palmer DH, Cunningham D, Anthoney A, Maraveyas A, et al. Cisplatin plus Gemcitabine versus Gemcitabine for biliary Tract Cancer. N Engl J Med. 2010;362:1273–81. - PubMed
    1. Moris D, Palta M, Kim C, Allen PJ, Morse MA, Lidsky ME. Advances in the treatment of intrahepatic cholangiocarcinoma: an overview of the current and future therapeutic landscape for clinicians. CA Cancer J Clin. 2023;73:198–222. - PubMed

MeSH terms